WebRad User Manual
Table of Contents
- 4. Location Setup
- 4.1 Location Information Structure
- 4.2 Setting up Location Information
- 4.2.1 Entering Operations
- 4.2.2 Entering Sites
- 4.2.3 Entering Sampling Areas
- 4.2.4 Entering Locations
- 4.2.5 Entering Location Parameters
- 4.2.6 Modifying Location Contaminants
- 5. Equipment Setup
- 5.1 Equipment Information Structure
- 5.2 Setting Up Equipment Information
- 5.2.1 Entering Equipment Types
- 5.2.2 Entering Equipment
- 5.2.3 Entering Parameter Names
- 5.2.4 Entering Parameter Values
- 5.2.5 Entering Calibrations
- 5.2.6 Entering Protection Equipment Types
- 5.2.7 Entering Protection Equipment Factors
- 6. Contaminants Setup
- 6.1 Contaminant Information Structure
- 6.2 Setting Up Contaminant Information
- 6.2.1 Entering Contaminants
- 6.2.2 Entering Direct Entry Methods
- 6.2.3 Choosing Locations
- 6.3 Contaminant Concentration Readings Entry Structure
- 6.3.1 Entering LLRD By Assayed Filter Method
- 6.3.2 Entering LLRD by Gross Counts
- 6.3.3 Entering Radon Progeny By Direct Entry Method
- 6.3.4 Entering Radon Progeny By Rolle Method
- 6.3.5 Entering User Added Contaminant Reading By Direct Entry Method
- 6.3.6 Entering User Added Contaminant Reading By Bulk Direct Entry Method
- 6.3.7 Entering Contamination Control Swipes
- 6.4 Searching Area Readings
- 7. Employee Setup
- 7.1 Employers
- 7.2 Employee Groups
- 7.3 Job Groups
- 7.4 Birth Places
- 7.5 Shift Types
- 7.6 Job Titles
- 7.7 Entering New Employees
- 7.7.1 Individual Entry
- 7.7.2 Bulk Entry
- 7.8 Entering Employee History Data
- 7.8.1 From Employees Page
- 7.8.2 Employee History Page
- 7.9 Entering New Pregnancy History Data
- 7.9.1 From Employees Page
- 7.9.2 Pregnancy History Page
- 7.10 Personal Scheduling
- 8. Time Card Setup
- 8.1 Entering Exposure Calculation Schemes
- 8.2 Entering Dosimetry Areas
- 8.3 Selecting Dosimetry Area Member Locations
- 8.4 Timecards
- 8.4.1 Enter Timecards
- 8.4.2 Time Cards Import
- 9. Personal Readings
- 9.1 Personal Readings Information Structure
- 9.1.1 Personal Readings Entry
- 9.1.2 Personal Readings Bulk Entry
- 9.2 Entering TLD Readings
- 9.3 Uranium Bioassay
- 9.4 OLD Import
- 9.5 Creating PADs
- 9.5.1 Creating PAD as Equipment
- 9.5.2 Generating PAD Transactions
- 9.6 PAD Export
- 9.7 PAD Import
- 9.8 Radiation Work Permits
- 10. Exposures
- 10.1 Exposures Overview
- 10.1.1 Exposures Due To Personal Readings
- 10.1.2 Exposures Due To Time Spent in Dosimetry Areas
- 10.2 Setting Up Dose Components
- 10.3 Calculating Monthly Exposures
- 10.4 Viewing Calculated Exposures
- 10.4.1 Viewing Daily Calculated Exposures
- 10.4.2 Viewing Monthly Calculated Exposures
- 10.4.3 Viewing Quarterly Calculated Exposures
- 11. Posting
- 11.1 Posting Overview
- 11.2 Posting Data and Final Exposure Calculations
- 11.2.1 Post Contaminant Concentration Readings
- 11.2.2 Post Personal Readings
- 11.2.3 Post Time Cards
- 11.2.4 Calculate Monthly Personal Exposures
- 11.2.5 Post Monthly Personal Exposures
- 12. Reports
- 12.1 Area Monitoring Reports
- 12.1.1 Area Monitoring Distribution Report
- 12.1.2 Area Monitoring Summary Report
- 12.1.3 COP Daily Report
- 12.1.4 Daily Summary Report
- 12.1.5 Location Report
- 12.1.6 Readings Report
- 12.2 Personal Monitoring Reports
- 12.2.1 CNSC Exposure Report
- 12.2.2 Personal Exposure Report
- 12.2.3 Quarterly NDR File
- 12.2.4 Quarterly Report
- 12.2.5 Running Year Dose Report
- 12.2.6 Radiation Work Permit Report
- 12.2.7 Top N% Effective Dose
- 12.2.8 U in U Report
- 12.2.9 Worker List Report
- 12.2.10 Yearly Report
- 12.3 Annual Reporting Suite
- 12.3.1 Collective Total Dose by NDR and Month
- 12.3.2 Dose Frequency by NDR Code
- 12.3.3 Dose Summary
- 12.3.4 5 Year Dose by NDR Code
- 12.4 France Reporting
- 12.4.1 Sustainable Development Report
- 12.5 Contamination Control Reporting
- 12.5.1 Contamination Control Swipe Report
- 12.5.2 General Contamination Control Report
- 12.6 Ventilation Reporting
- 12.6.1 Ventilation Report
1. Flow Chart
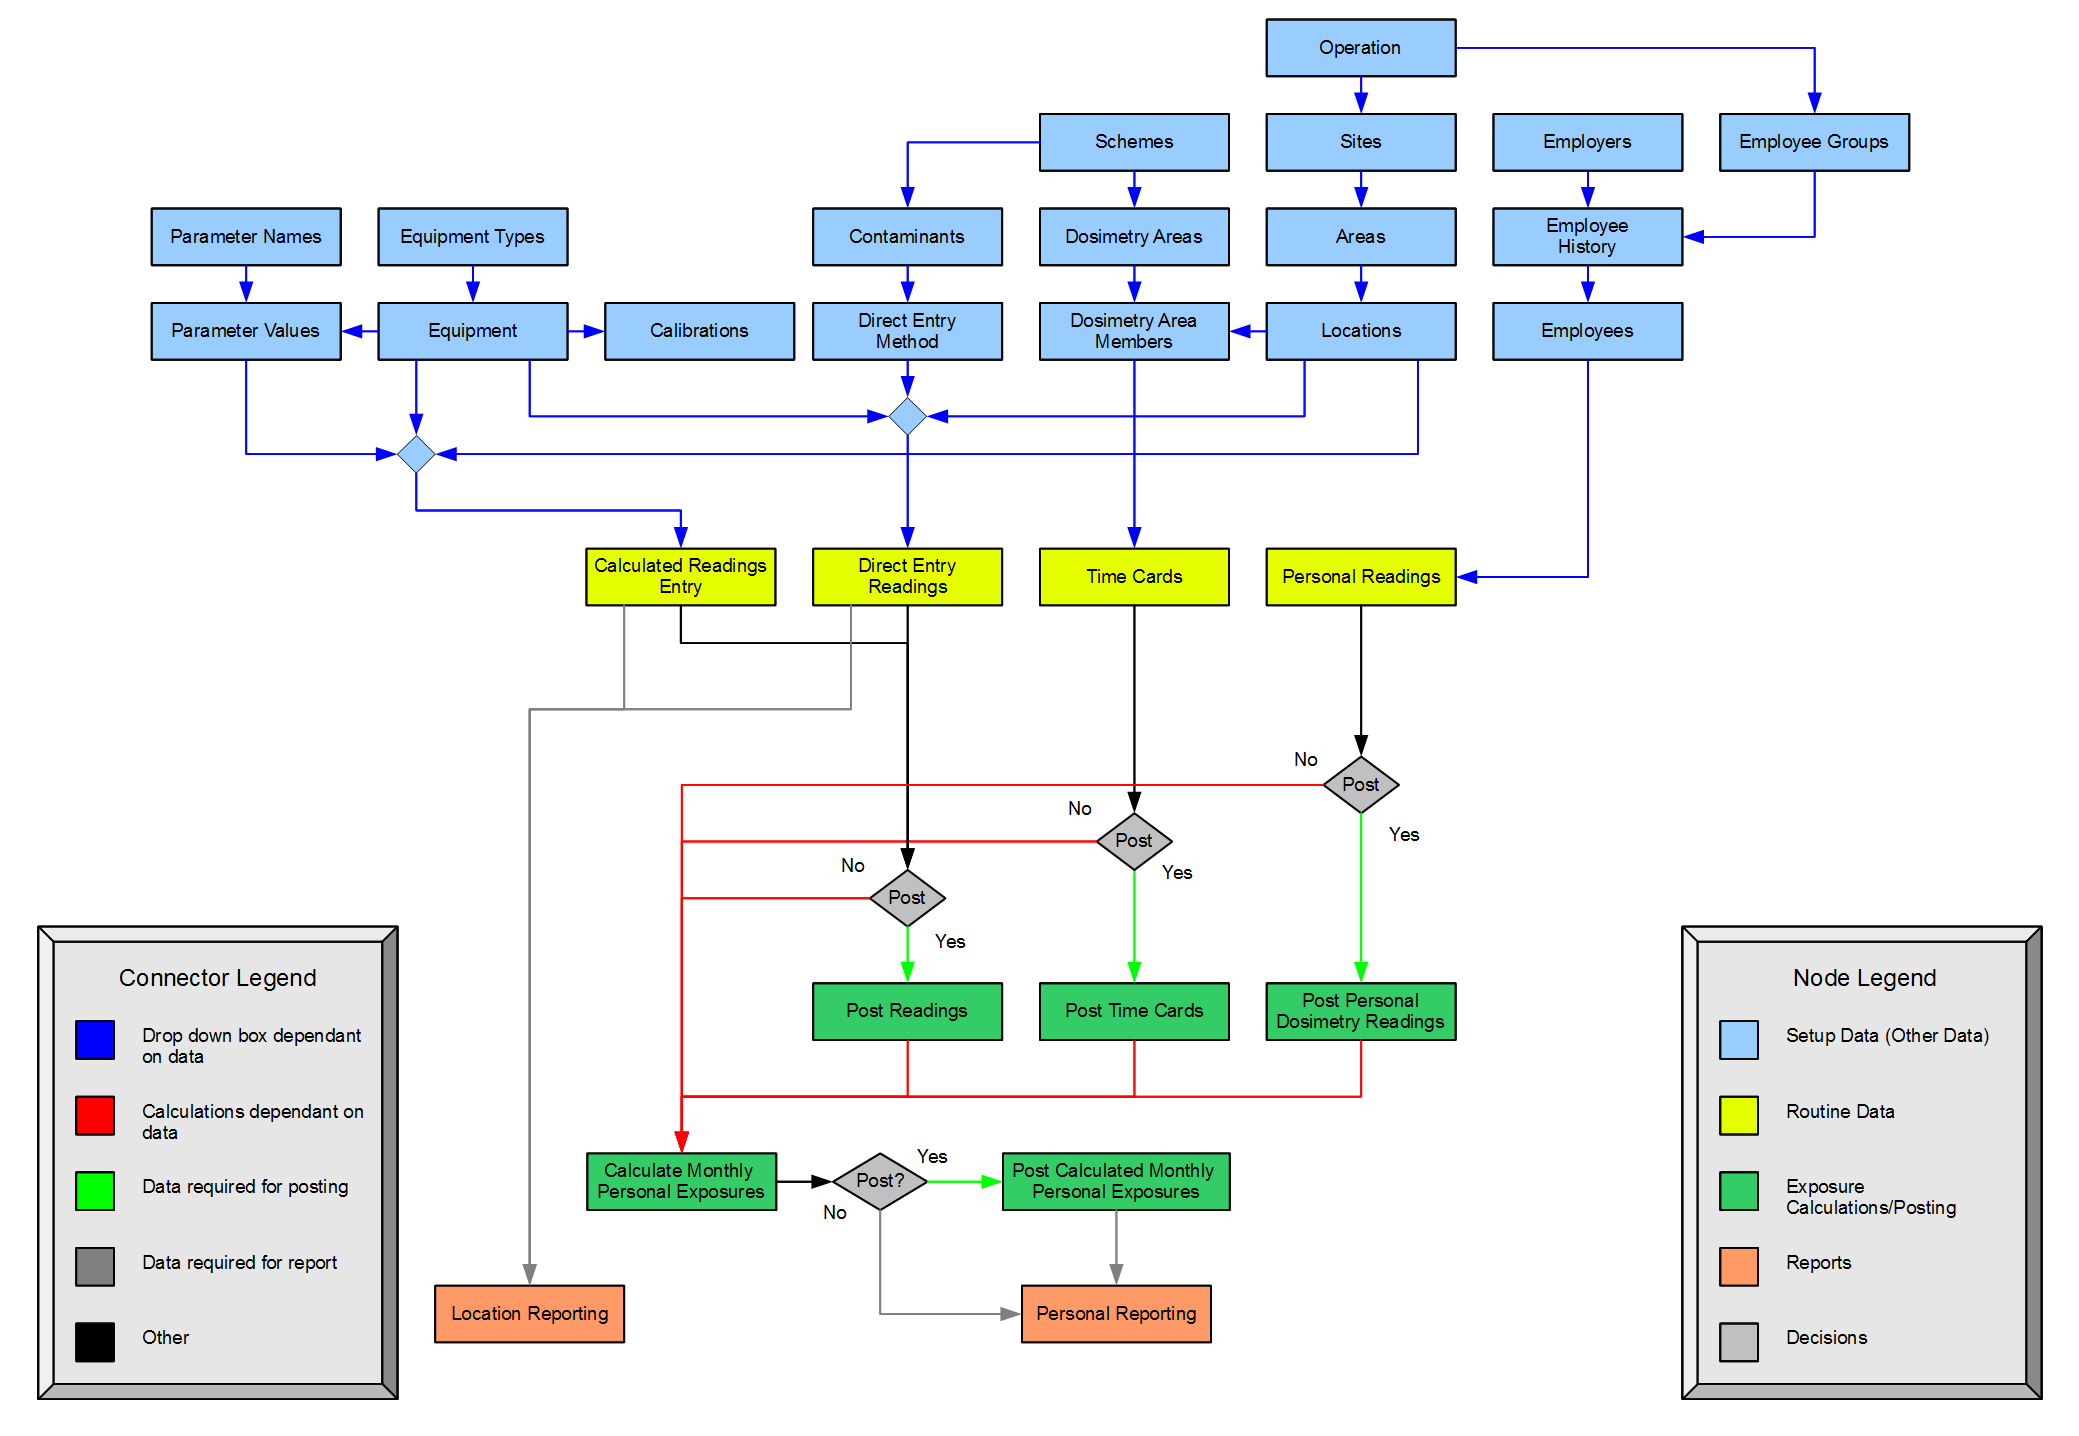
This flow chart shows the general flow of data in WebRad. This provides a visual representation of the order in which data can be entered.
For the most part, each node in the flow chart corresponds to a single page in WebRad. One exception to this is "Calculated Readings Entry, which consists of "LLRD Entry By Assayed Filter Method" and the general "Calculated Readings" page.
The "Post?" decision blocks should generally be answered all yes, or all no. It is possible to start out posting data, and then stop posting subsequent data, however, data based on unposted data will not to postable. For more information on posting, see section 11.
2. Overview
The main function of WebRad is to record radiation levels and personal doses in a systematic and traceable manner. Among other things, WebRad keeps track of which equipment was used to take the measurement and in which location the measurement was taken. To ensure that only valid locations and equipment are stored with the monitoring results, these parameters are selected from drop down lists.
Before we can enter the actual radiation data, we have to enter the parameters that will show up in the dropdown boxes. This includes information on the following:
- Locations
- Equipment
- Employees
In order to calculate personal exposures, we also have to tell the program how the exposure is to be calculated.
3. General Navigation
WebRad's main navigation is done via the menu bar. The user can mouse over the various categories to view the sub categories within it and from there click on the page they want. Alternatively, clicking on a main category will bring you to a map of all pages within that category.
3.1 Filtering Views
Certain tables in WebRad can potentially contain vast amounts of information. In order to make it easier to find the data you are looking for, filtering capability has been added to many of these areas.
The Filter tool allows you to do an inclusive search. From each category you can choose multiple search parameters, but results will only be returned where an item matches at least one entry in all categories you choose a parameter from. You can simplify or broaden your search by leaving categories entirely blank, or by selecting less parameters in each.
You can return to the full data view by clearing the filter using the "Clear Filter" button, and you can hide the Filter Tool from sight using the "Show/Hide Filter" Button.
4. Location Setup
4.1 Location Information Structure
WebRad supports four levels of physical location information: Operation, Site, Sampling Area, and Location.
"Operation" is the most general. This would refer to an entire mining operation.
"Site" is the next most general. Typical Sites would be "Mine" or "Mill".
"Areas" are groupings of locations within a site. Several Areas on can be designated to a single Site. WebRad can be set up such that a single Area can be used to encompass the entire Site. In other cases, an Area could be one level in a mine or a certain process section of a mill.
"Locations" are the most specific. Locations specify the places where a measurement is taken. For example the face of a particular heading would be a "Location".
The Site and Sampling Areas are used for generating summary reports, showing the number of readings taken during a particular time period and their average and maxima. Customers who are not interested in this type of summary reporting can just enter one Site and one Sampling Area and call it a generic name, such as "General".
4.2 Setting up Location Information
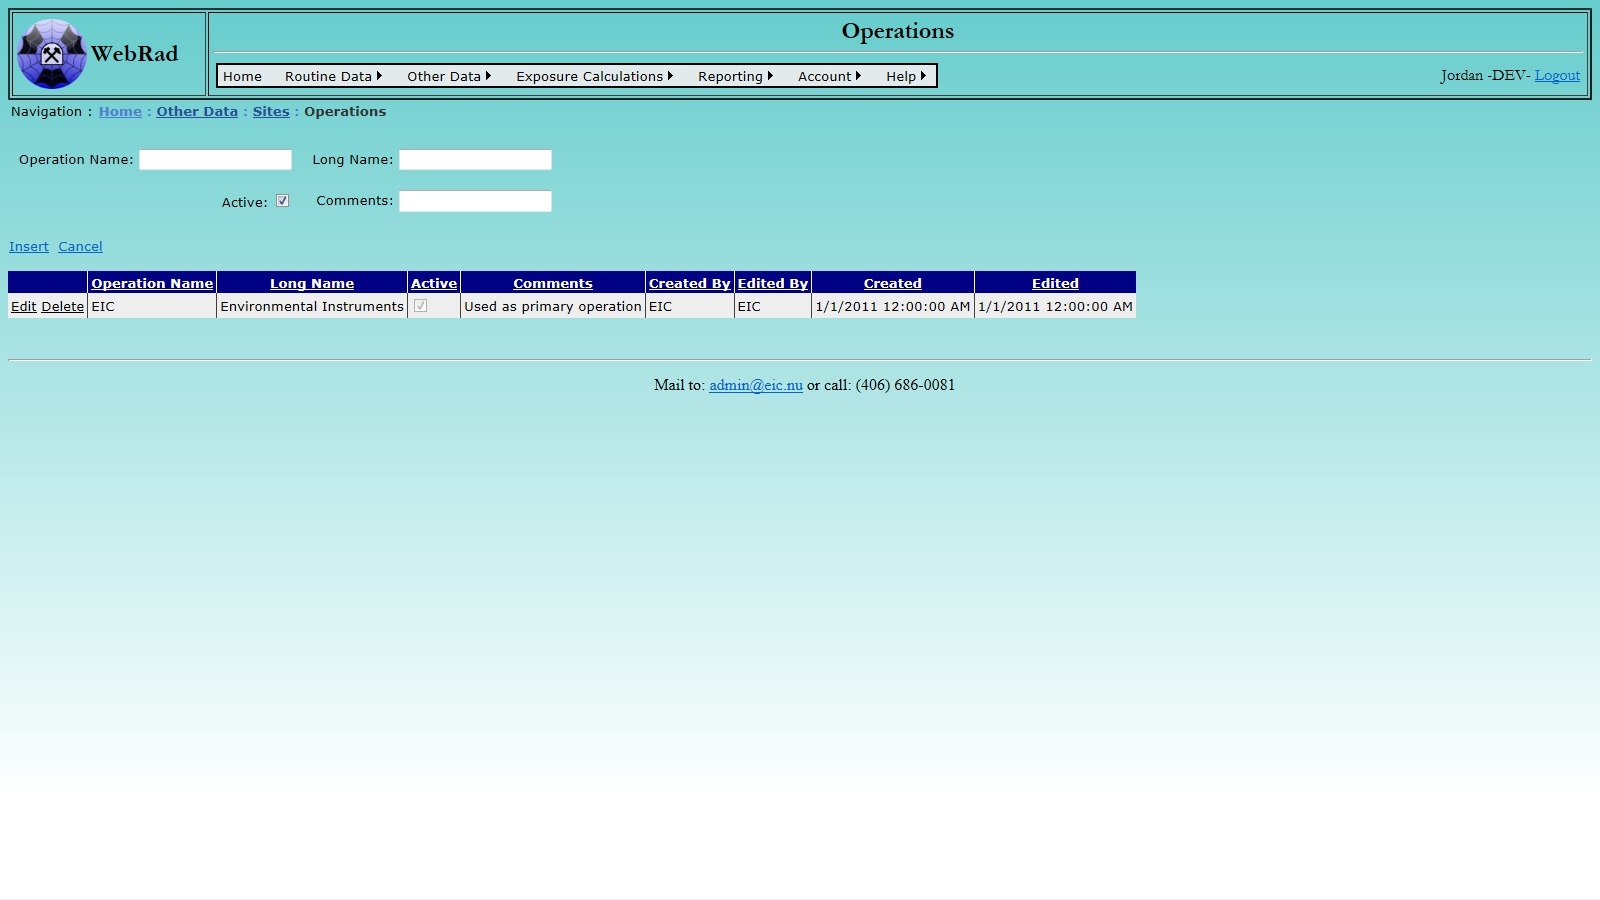
4.2.1 Entering Operations
Set up your list of operations first. Mouse over "Other Data" on the menu bar, go down to "Sites", go over and click on the "Operations" link. Click on "New Operation". Enter the operation name and long name. The operation name is what the operation is commonly referred to, and may be an actual name or a code. This is what will appear in drop down lists when this operation is to be selected. The long name is a description of the operation. Make sure the "Active" check box is checked. (Only "Active" operations show up in drop-down menus.) Click on "Insert". The new operation now shows up in the grid view.
4.2.2 Entering Sites
Set up your list of Sites first by: Mouse over "Other Data" on the menu bar, go down to "Sites", go over and click on the "Sites" link. Click on "New Site". Enter the site name and long name. The site name is what the site is commonly referred to, and may be an actual name or a code. This is what will appear in drop down lists when this site is to be selected. The long name is a description of the site. Next select which operation it belongs to from the drop down box. Make sure the "Active" check box is checked. (Only "Active" sites show up in drop-down menus.) Click on "Insert". The new site now shows up in the grid view.
Also note that reports that show contaminant reading excursions are site specific. That is to say that each site can be assigned its own set of excursions which dictates whether or not it is flagged in the area monitoring reports.
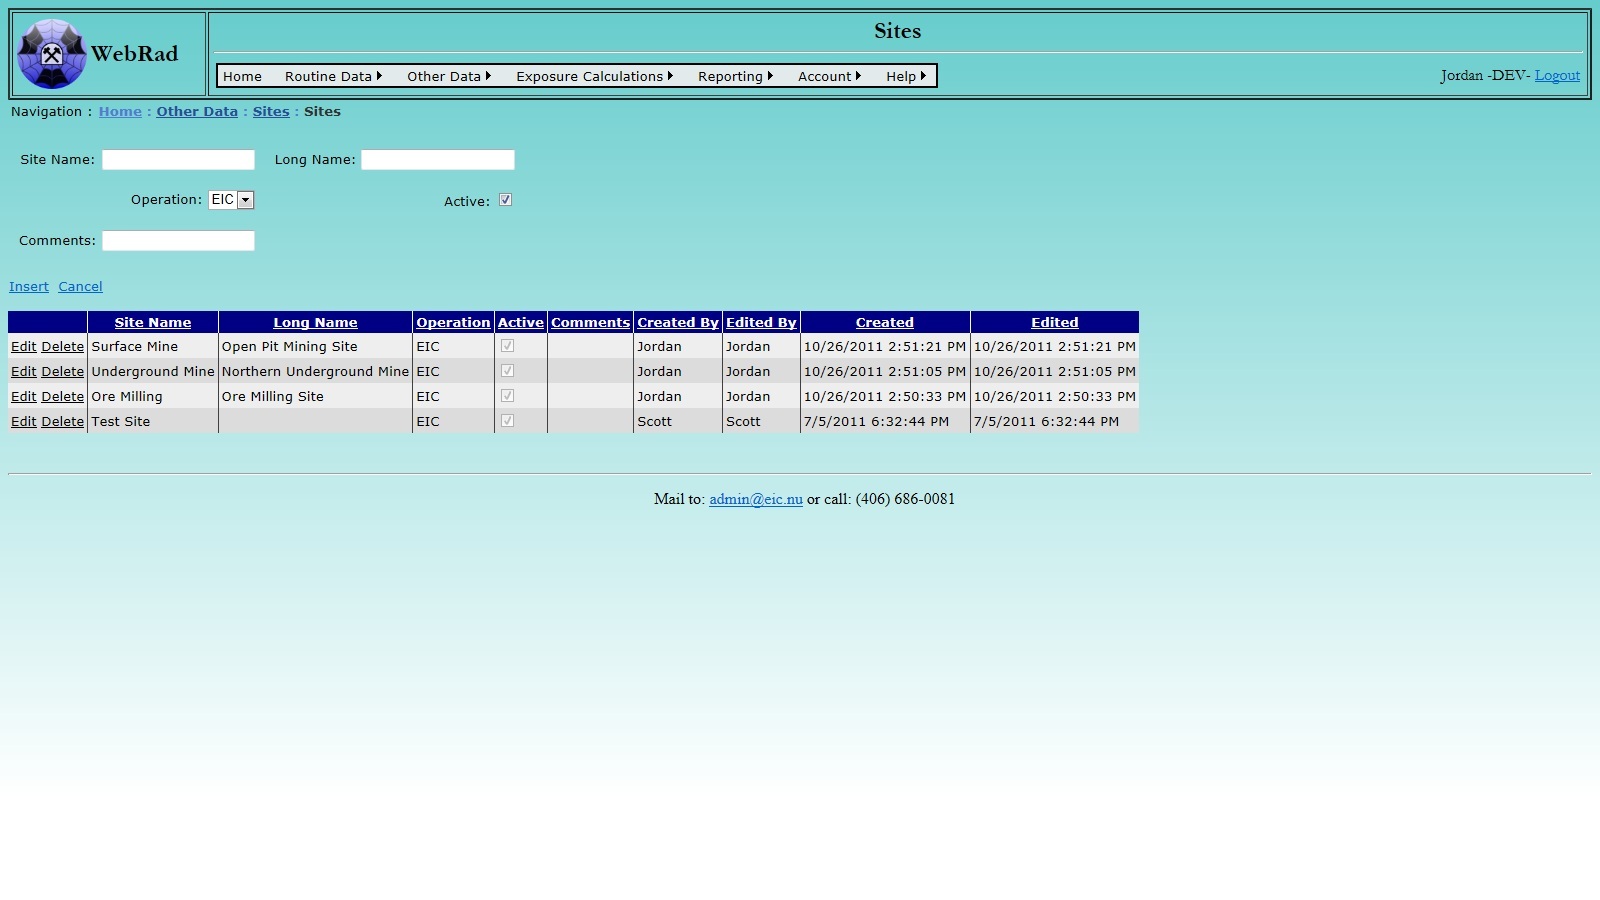
The grid view below the form allows you to Edit and Delete previous entries. However, it will not allow you to delete a Site against which other data has been recorded. If we try to delete "Underground Mine", we get the following error message, because we have Sampling Areas within the Underground Mine. To delete the Underground Mine, we have to first clean up any data that depends on it.
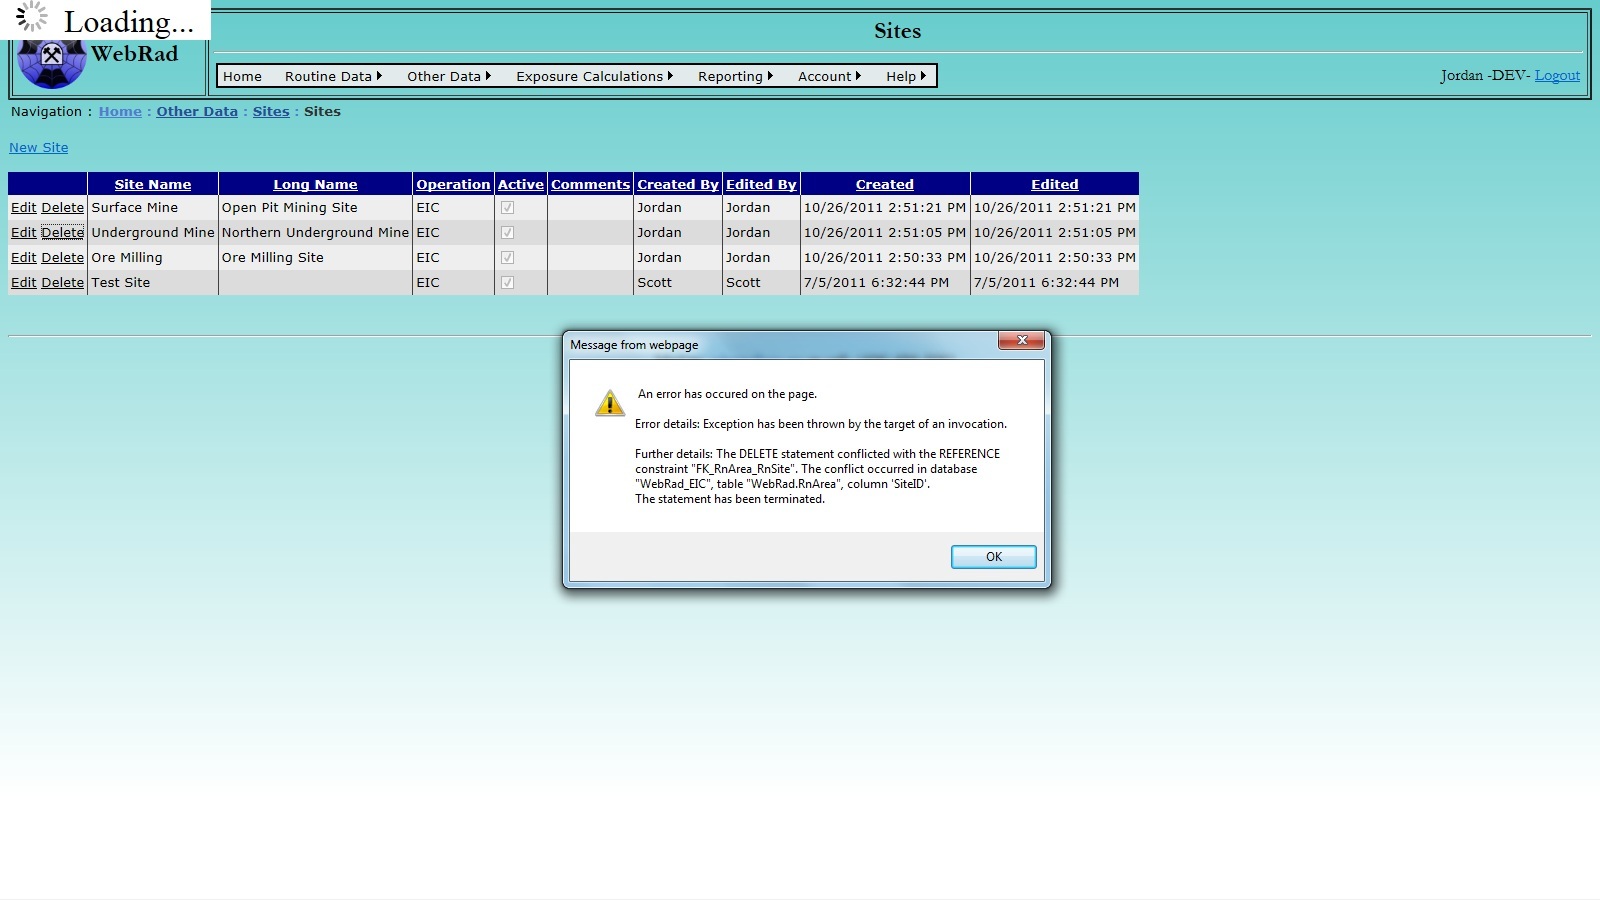
Instead of deleting Underground Mine, we could simply make it inactive (uncheck the "Active" button). This just makes the Underground Mine unavailable for future data entry, but does not affect the integrity of the existing data.
4.2.3 Entering Sampling Areas
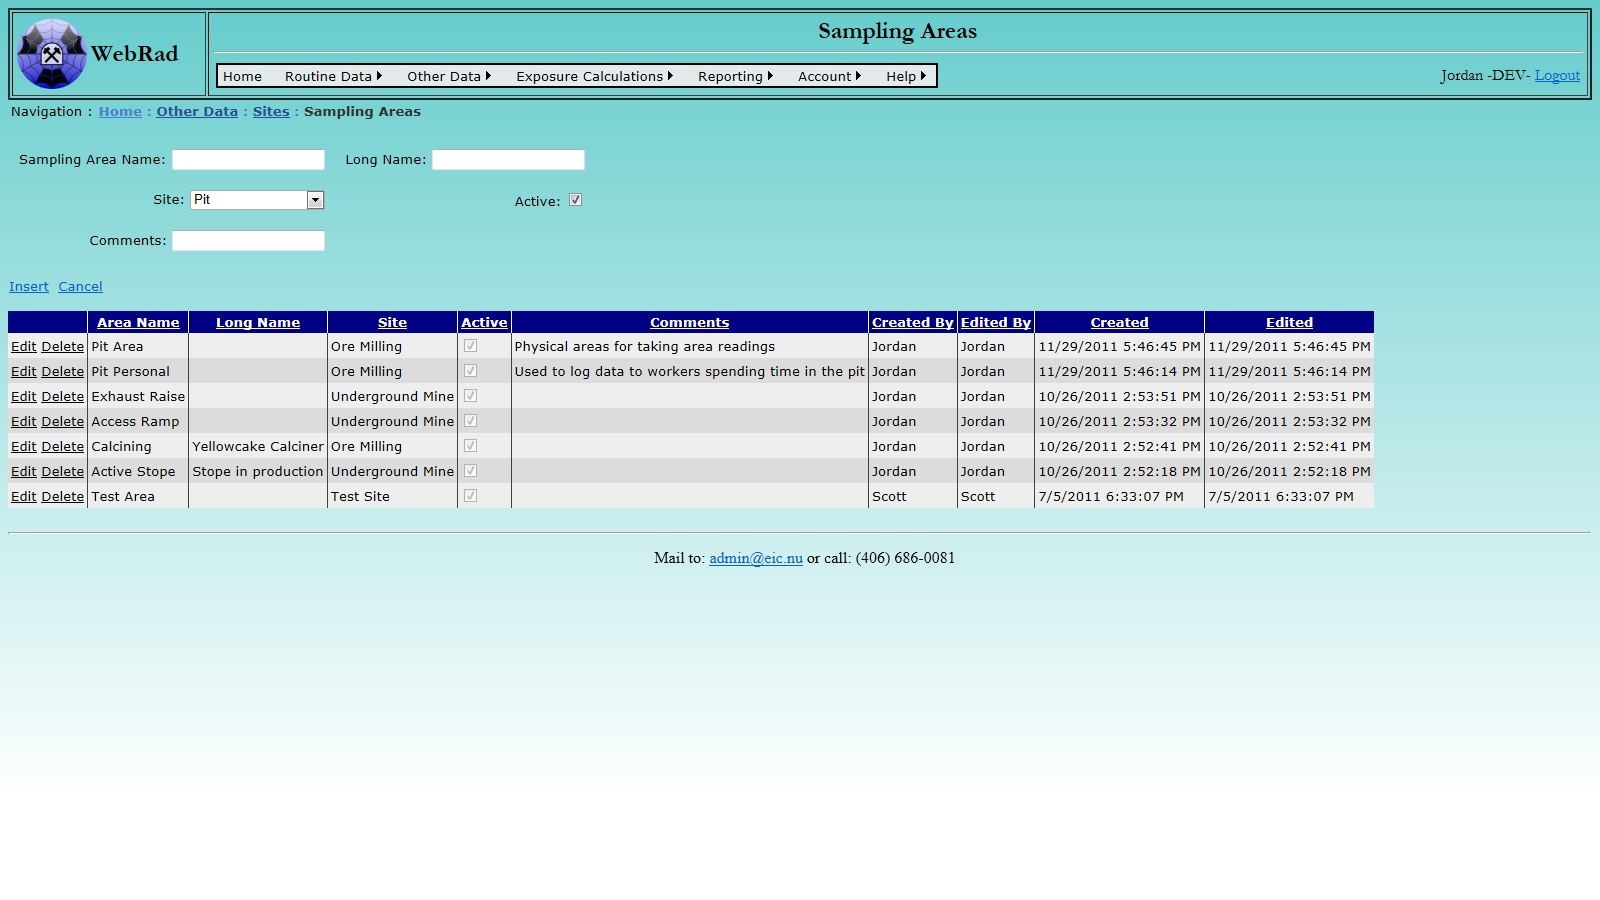
Next, set up your "Sampling Areas". Mouse over "Other Data" on the menu bar, go down to "Sites", go over and click on the "Sampling Areas" link. Click on "New Sampling Area". Enter the sampling area name and long name. The sampling area name is what the sampling area is commonly referred to, and may be an actual name or a code. This is what will appear in drop down lists when this sampling area is to be selected. The long name is a description of the sampling area. Select which site it belongs to from the drop-down box. Make sure the "Active" check box is checked. (Only "Active" sampling areas show up in drop-down menus.) Click on "Insert". The new sampling area now shows up in the grid view.
In the example below, we have chosen to treat the entire pit as one Sampling Area and not to subdivide it further. Note that WebRad can be used to track both area and personal samples, as shown below.
4.2.4 Entering Locations
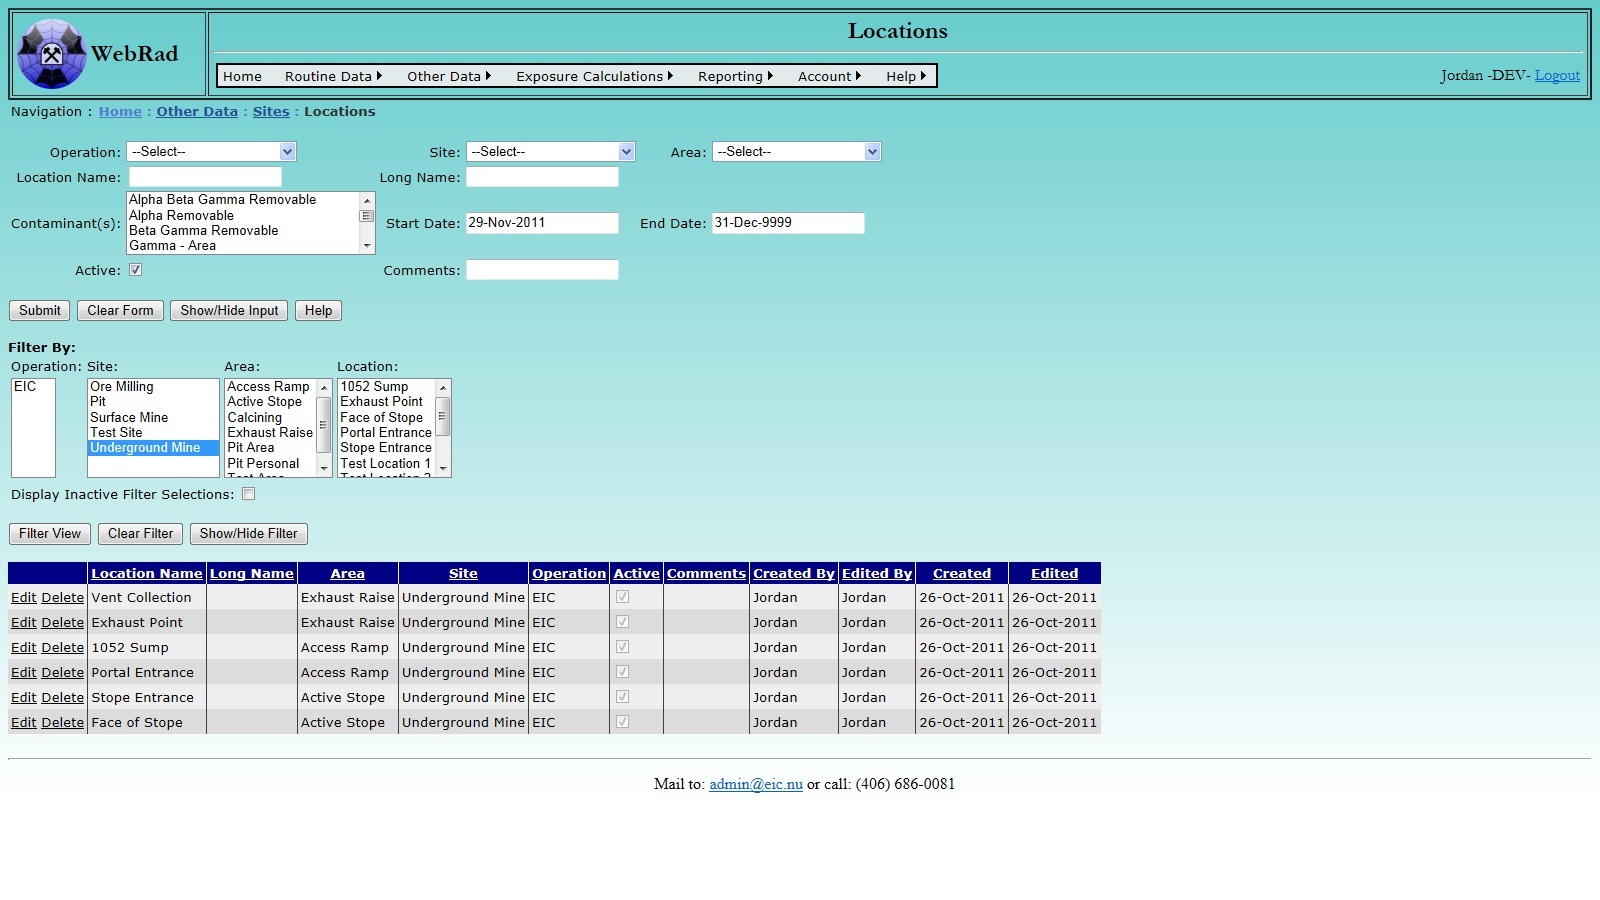
Next, set up your "Locations". Mouse over "Other Data" on the menu bar, go down to "Sites", go over and click on the "Locations" link. All the existing locations are displayed. Before creating a location, select an operation from the drop down box. This will filter the site drop down box. Choosing a site will in turn filter the available areas within the site. Select an area to create the location under. Next, enter the location name and long name. The location name is what the location is commonly referred to, and may be an actual name or a code. This is what will appear in drop down lists when this location is to be selected. The long name is a description of the location. Next, select which sampling area it belongs to from the drop-down box. Then select the contaminant(s) and the corresponding start date and end date for the contaminant(s) of this new location. To select multiple contaminants hold down the "Ctrl" on the keyboard and highlight each contaminant that will be monitored at that location. By default, the start date is set to the current date and the end date is set to indefinite. Make sure the "Active" check box is checked. (Only "Active" Locations show up in drop-down menus.) Enter comments for this new location. Click on "Submit" button. The new location will show up in the grid view. Note that the filter can be used to look for locations that already exist. By default, WebRad does not allow locations to be added with names that are already used in the database.
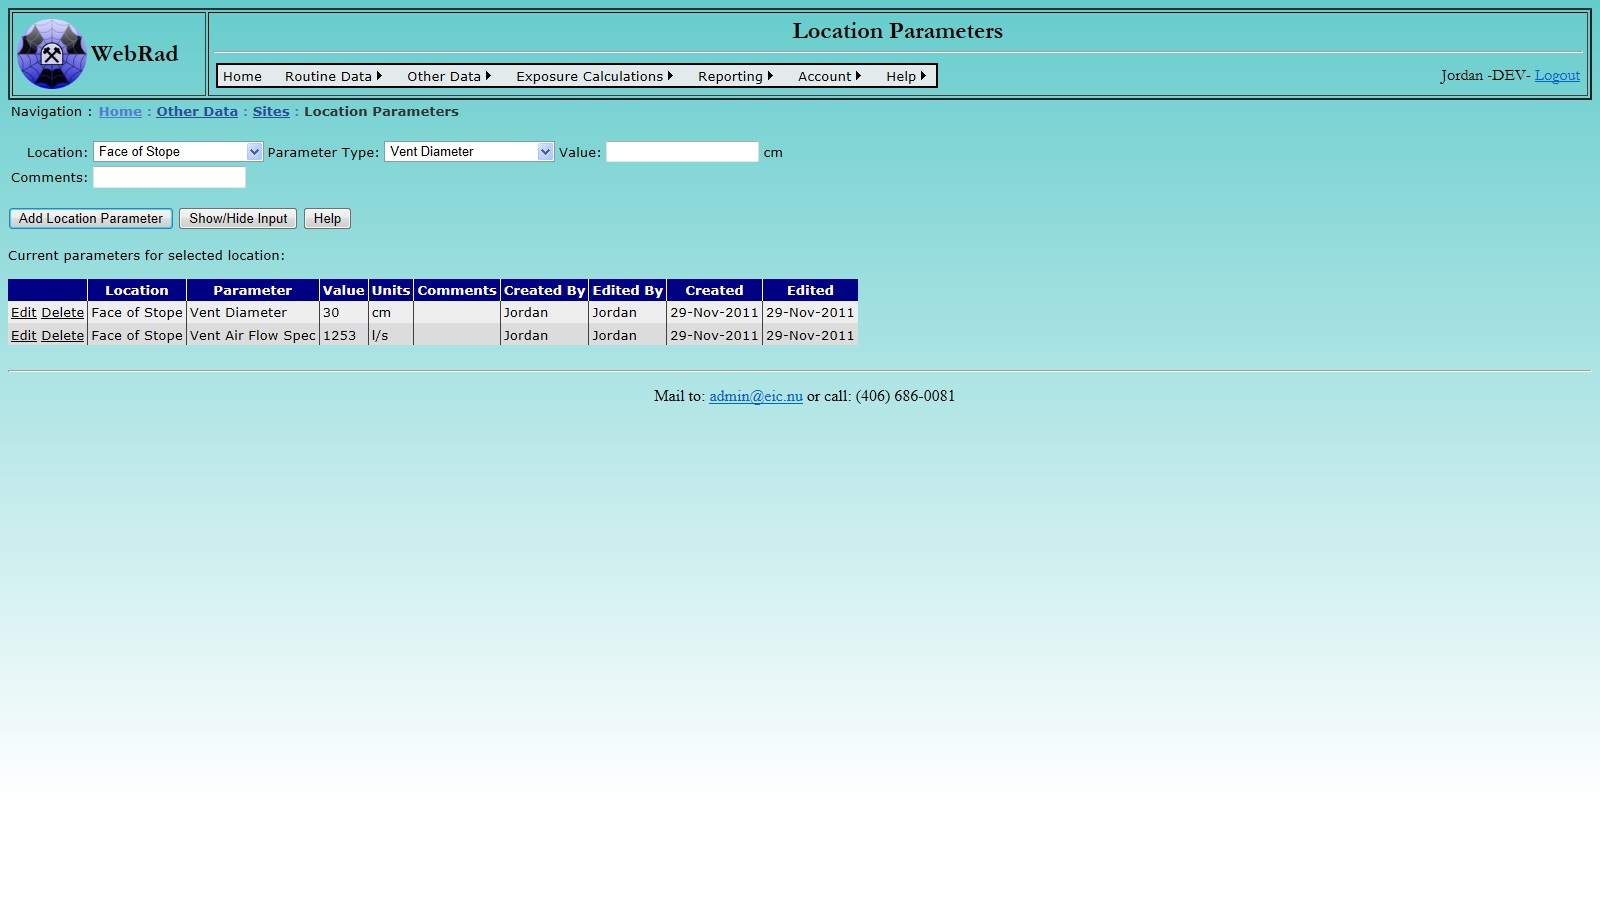
4.2.5 Entering Location Parameters
Next, set up your "Location Parameters". Mouse over "Other Data" on the menu bar, go down to "Sites", go over and click on the "Location Parameters" link. All the existing "Active" locations are displayed in the drop down box. Select a location from the drop down box that you wish to add a parameter to. Once a location is selected, all of the associated parameters for that location will be displayed in the grid view below. Next select a "Parameter Type". With a "Parameter Type" selected, a units value will be displayed beside the "Value" text box. Here you can enter the value for the given parameter. Take note that if these values are to be used in reports, such as the "Vent air flow spec" used for the "Ventilation Report", then they must be entered solely in a numeric form otherwiese the report will not be able to do calculations based on the given parameter. Enter the comments for the new location parameter and then press the "Add Location Parameter" Button.
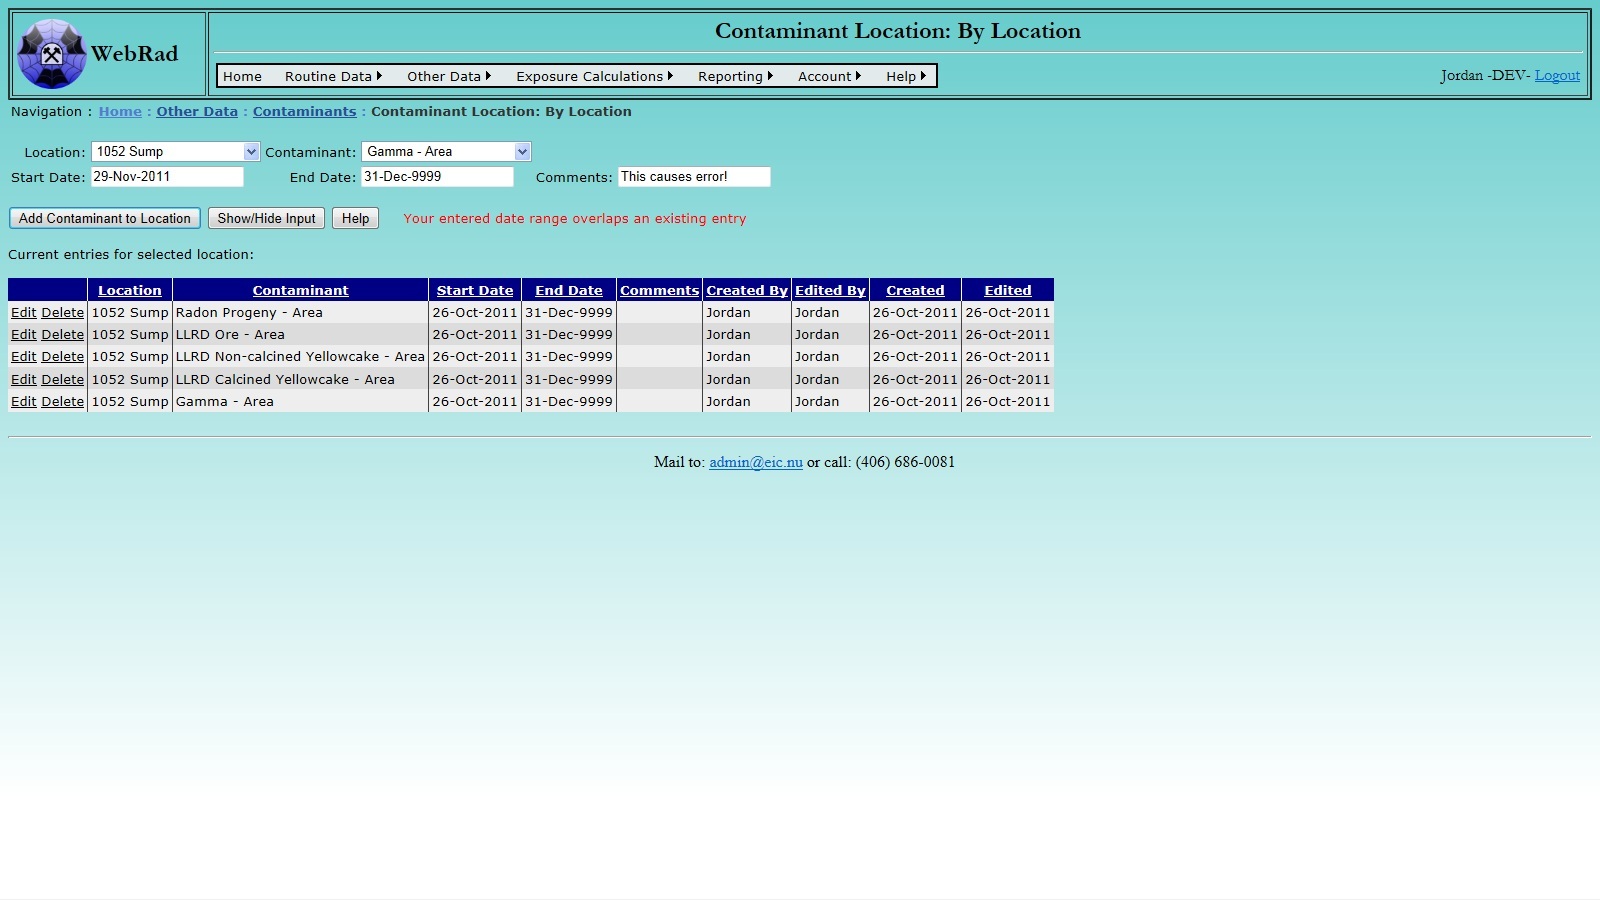
4.2.6 Modifying Location Contaminants
It is sometimes required to modify the contaminants that can be measured at a location, or add additional contaminants to a location. In order to accomplish this, Mouse over "Other Data" on the menu bar, go down to "Contaminants", go over and click on the "Contaminant Location: By Location" link. Choose a location from the "Location" drop down box. The grid view below will populate with a list of all the current contaminants associated to that location, and the corresponding date ranges for each contaminant to be associated to that location. At this point additional contaminants may be added to a location for a given date range, or date ranges may be edited straight from the grid view below. To add a new contaminant and date range, select the contaminant from the "Contaminant" drop down box and pick a date range for the contaminant to be associated to that location. Note that date ranges for a specific contaminant must be unique and are not allowed to overlap. If this does happen you will get an error message and the record insertion will fail. The default date for the end date is set to December 31, 9999. If you wish to stop a contaminant on a certain date, you must modify its record using the "Edit" button and set the end date to an earlier point in time.
5. Equipment Setup
5.1 Equipment Information Structure
WebRad contains lists of the radiation equipment on site, the types of equipment (AlphaCounters, Gamma Meters, Pumps, etc.), the calibration dates, and equipment parameter types (Efficiency, Flow Rate, etc.), as well as the equipment parameter values.
5.2 Setting up Equipment Information
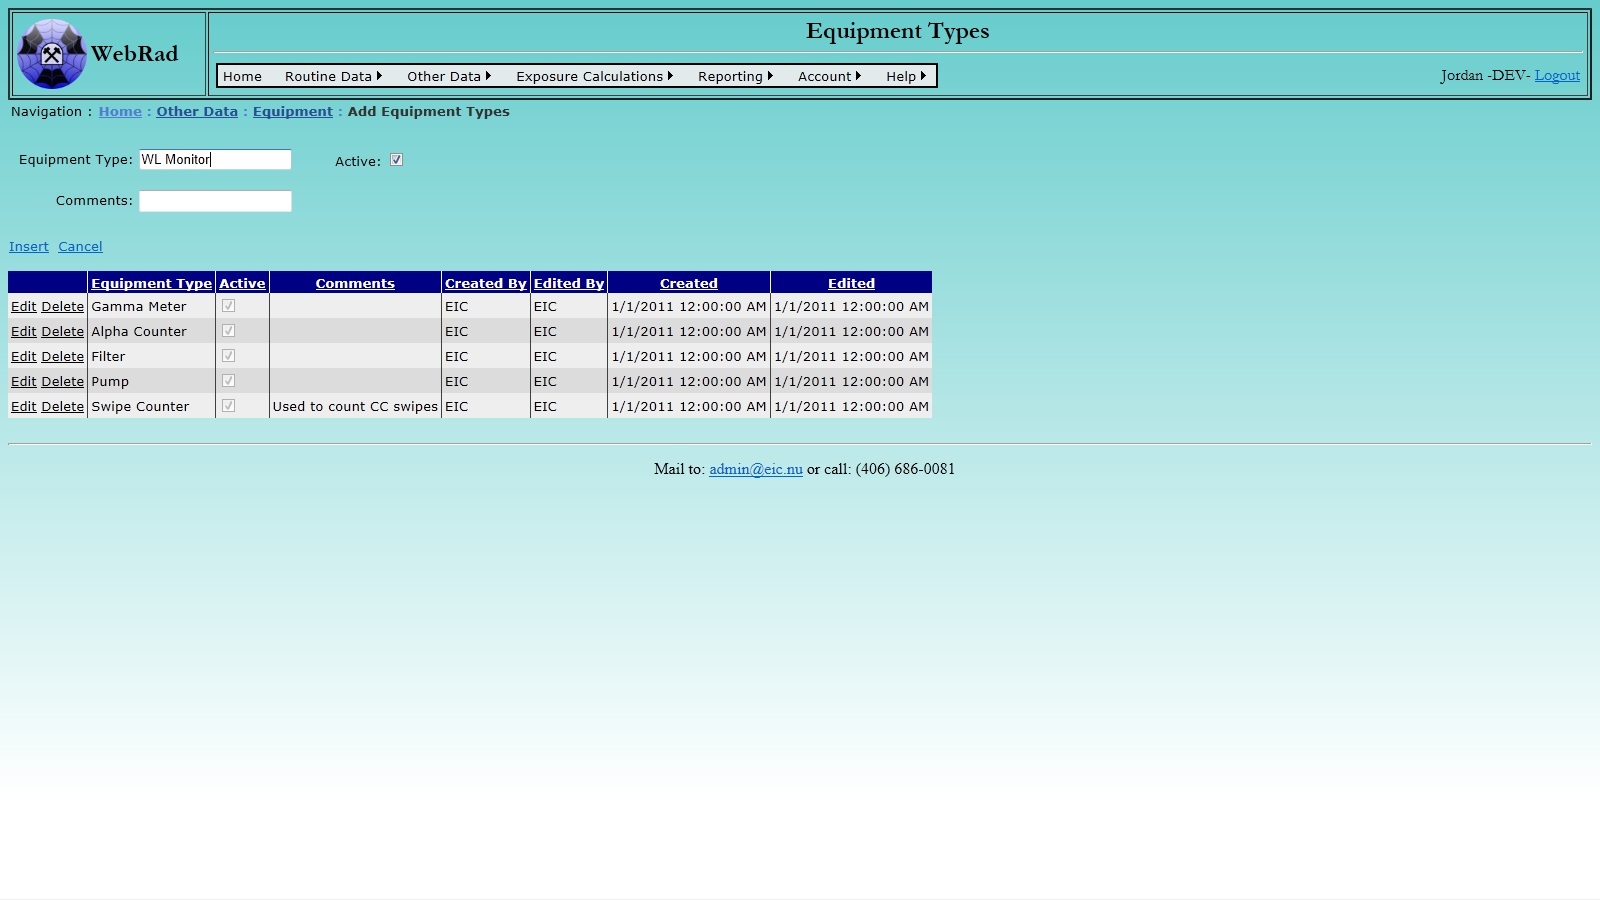
5.2.1 Entering Equipment Types
Set up your list of Equipment Types first by mousing over "Other Data" on the menu bar, go down to "Equipment", go over and click on the "Add Equipment Type" link. Click on "New Equipment Type". Enter the Equipment Type and make sure the "Active" check box is selected. (Only "Active" types show up in drop-down menus.) Click on "Insert". The new type now shows up in the grid view.
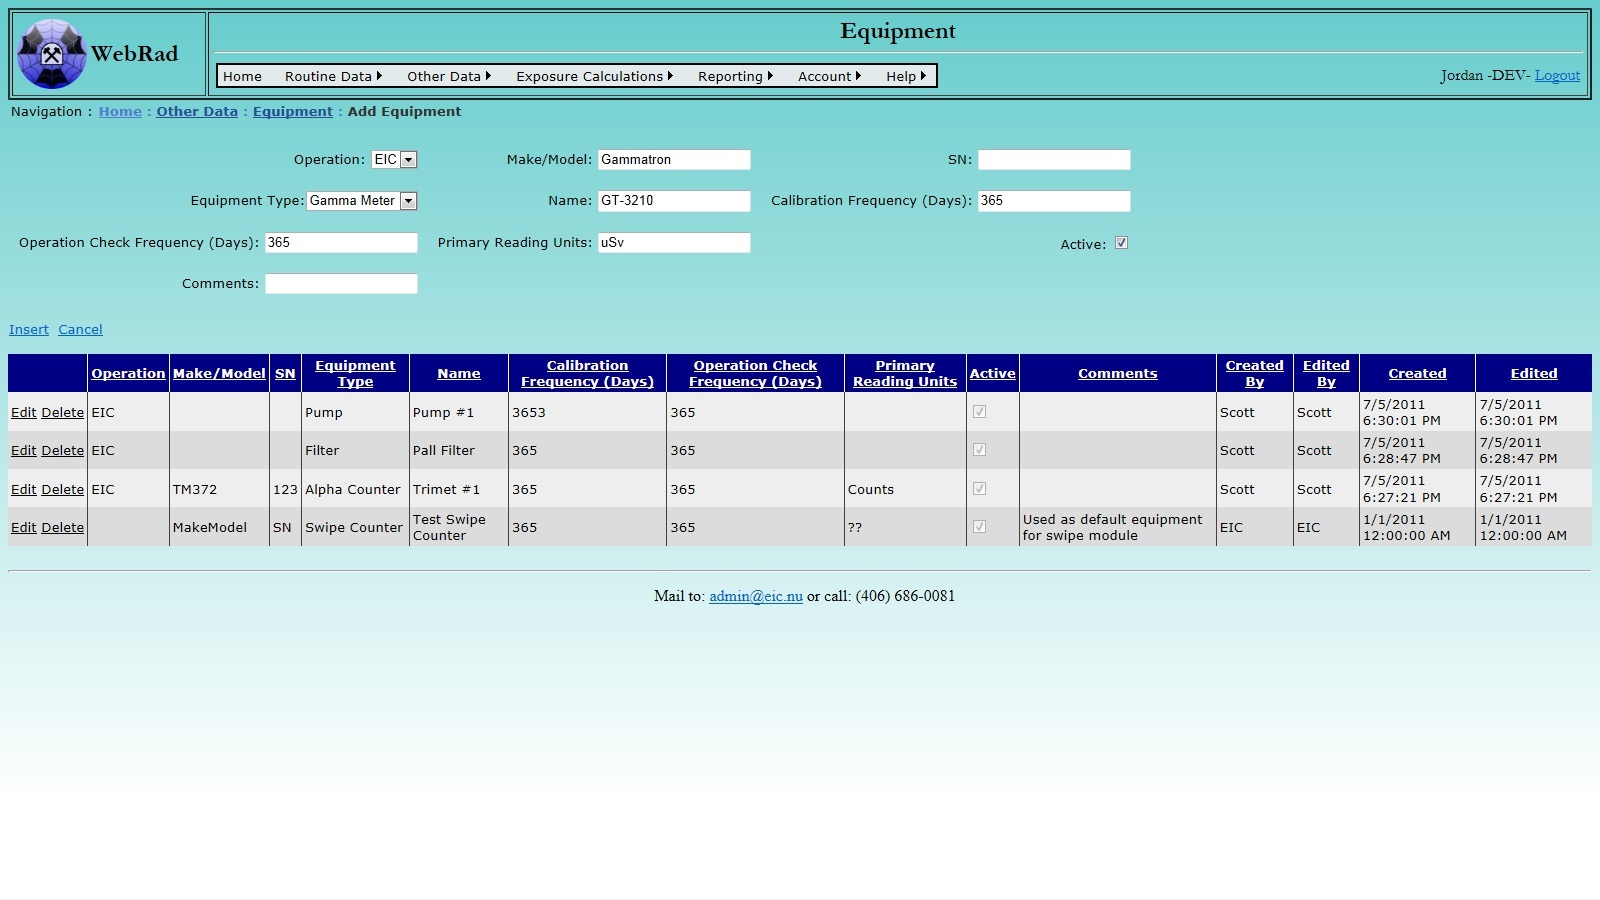
5.2.2 Entering Equipment
Next, set up your "Equipment" list. Mouse over "Other Data" on the menu bar, go down to "Equipment", go over and click on the "Add Equipment" link. Click on "New Equimpent". First select the operation that the equipment belongs to from the "Operation" drop down box. Enter the Make/Model and Serial Number. Select the Equipment Type from the drop-down. Make sure the "Active" check box is checked. (Only "Active" Equipment show up in drop-down menus.) Give the Equipment a simple name. This is the name that is commonly used for this piece of equipment on your site. For example, you may have a TM372 Alpha Counter manufactured by Environmental Instruments Canada Inc. with serial number 213, but you may just want to refer to it as "TM#1". You can also specify calibration and operational check frequencies, in days between calibrations. (This is optional and is not needed for entering sampling data.) Also enter the equipment's default measuring unit. This unit will be displayed on pages that allow for generic entry of readings. Click on "Insert". The new Equipment now shows up in the grid view.
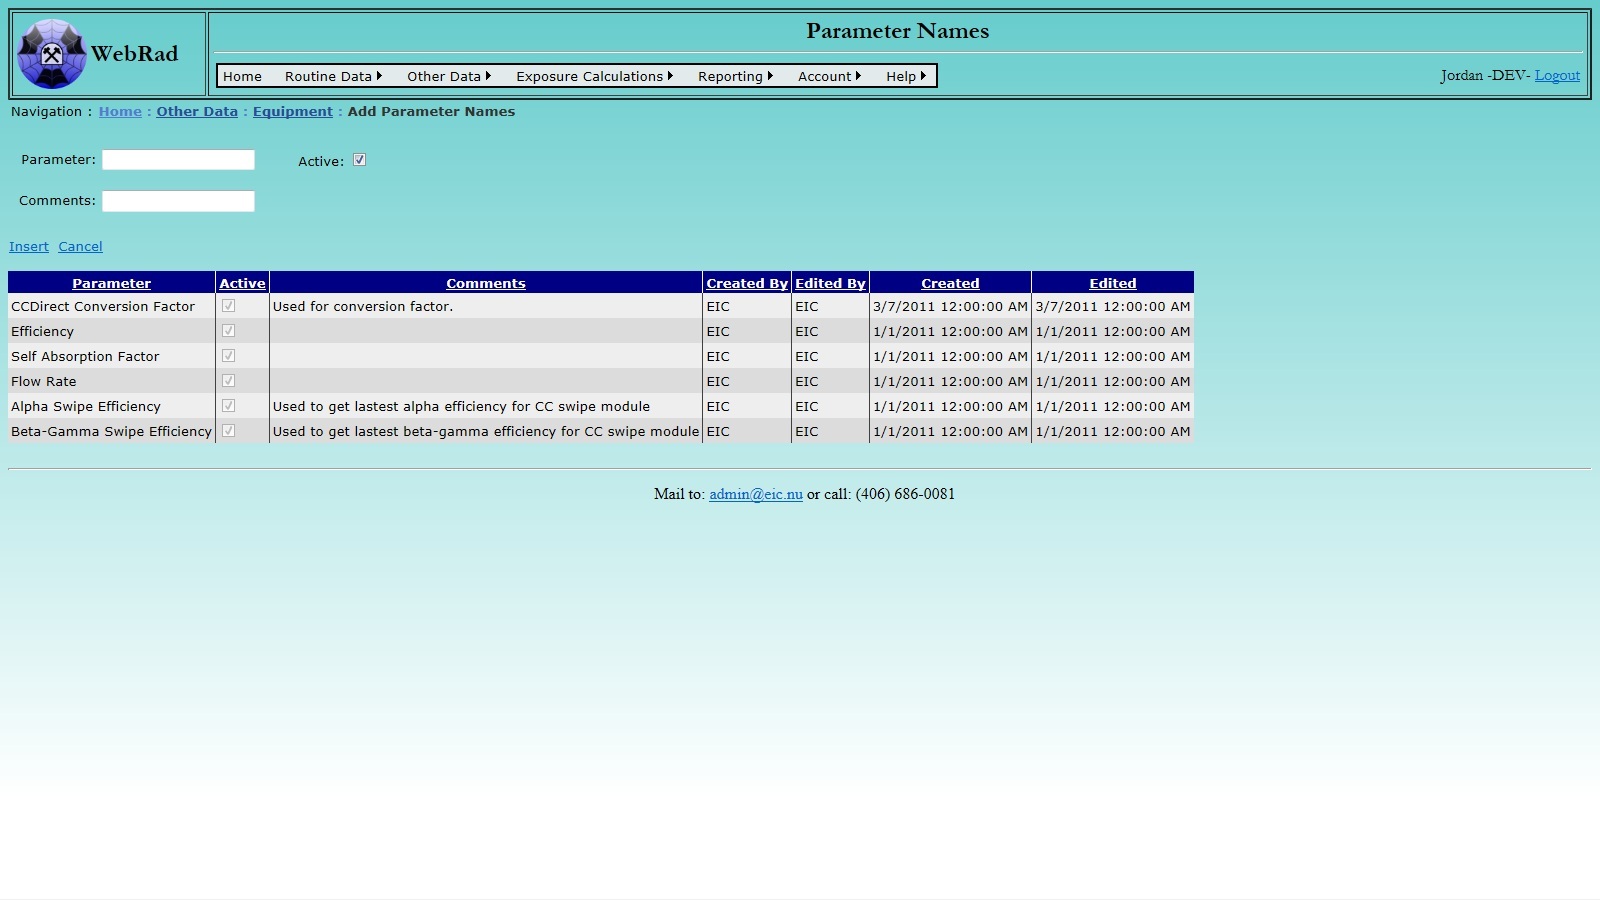
5.2.3 Entering Parameter Names
Next, set up your "Parameter Names". This is optional. The required parameter names for entering radon progeny and LLRD data are included in your database by default. Mouse over "Other Data" on the menu bar, go down to "Equipment", go over and click on the "Add Parameter Names" link. Click on "New Parameter Name". Enter the Parameter name and make sure the "Active" check box is checked. Click on "Insert". The new Parameter Name now shows up in the grid view.
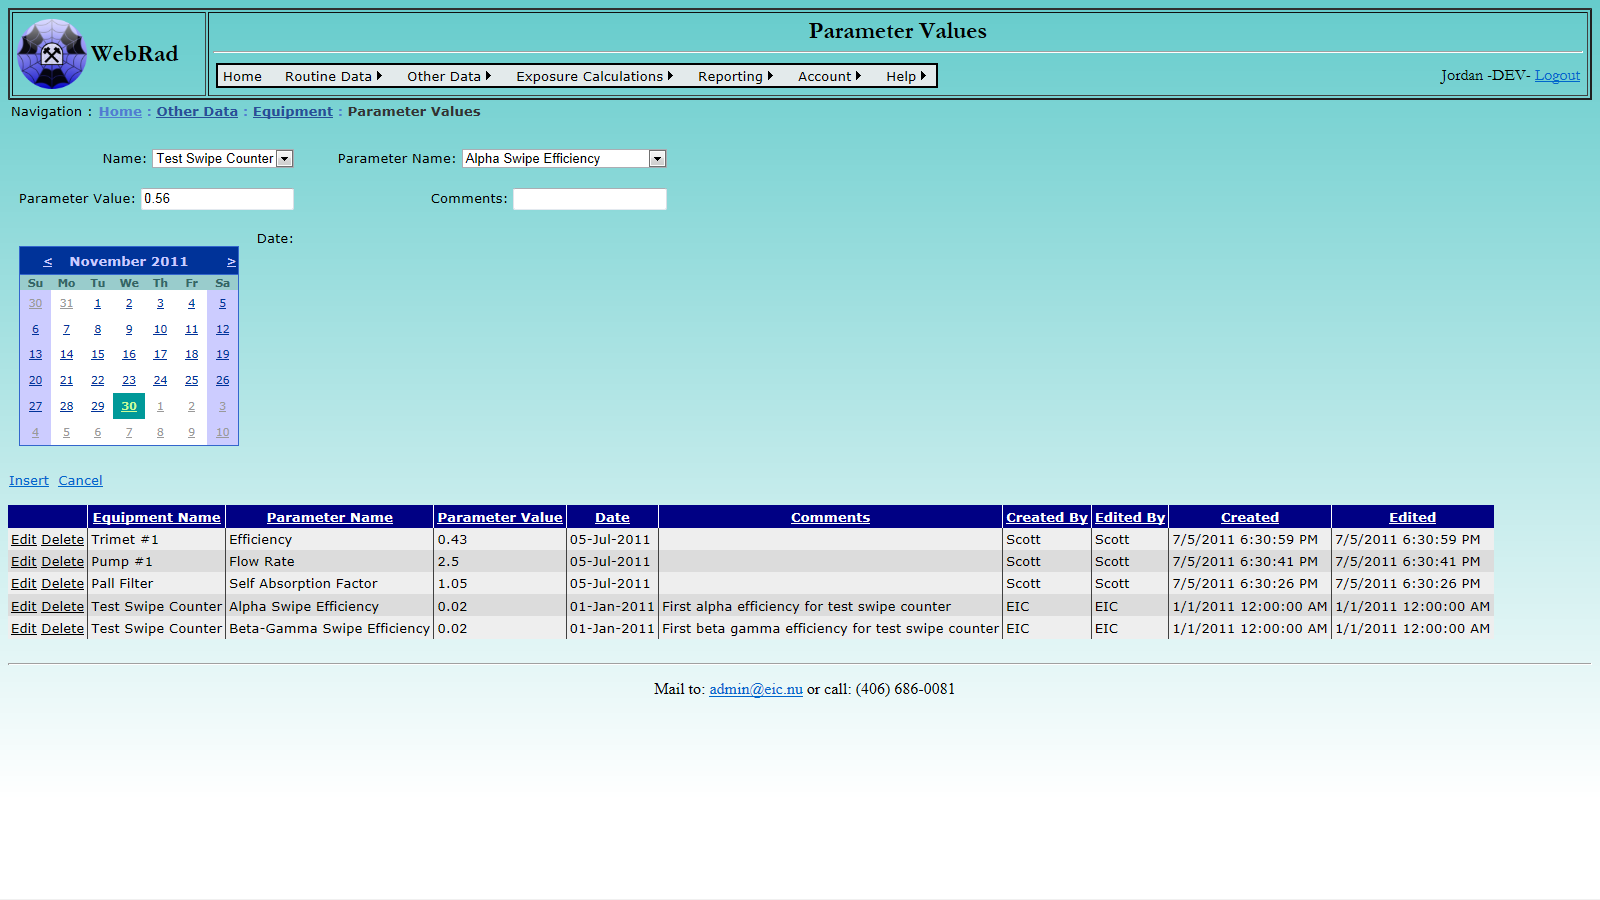
5.2.4 Entering Parameter Values
Next, set up your "Parameter Values". Mouse over "Other Data" on the menu bar, go down to "Equipment", go over and click on the "Parameter Values" link. Click on "New Parameter Value". Select the Equipment Name and Parameter Name from the drop down boxes and enter the parameter value. Select the date the parameter was established. For example, if you are entering a pump flow rate, enter the date that it was measured. The program uses the lates value in drop-down boxes. Click on "Insert". The new Parameter Value now shows up in the grid view.
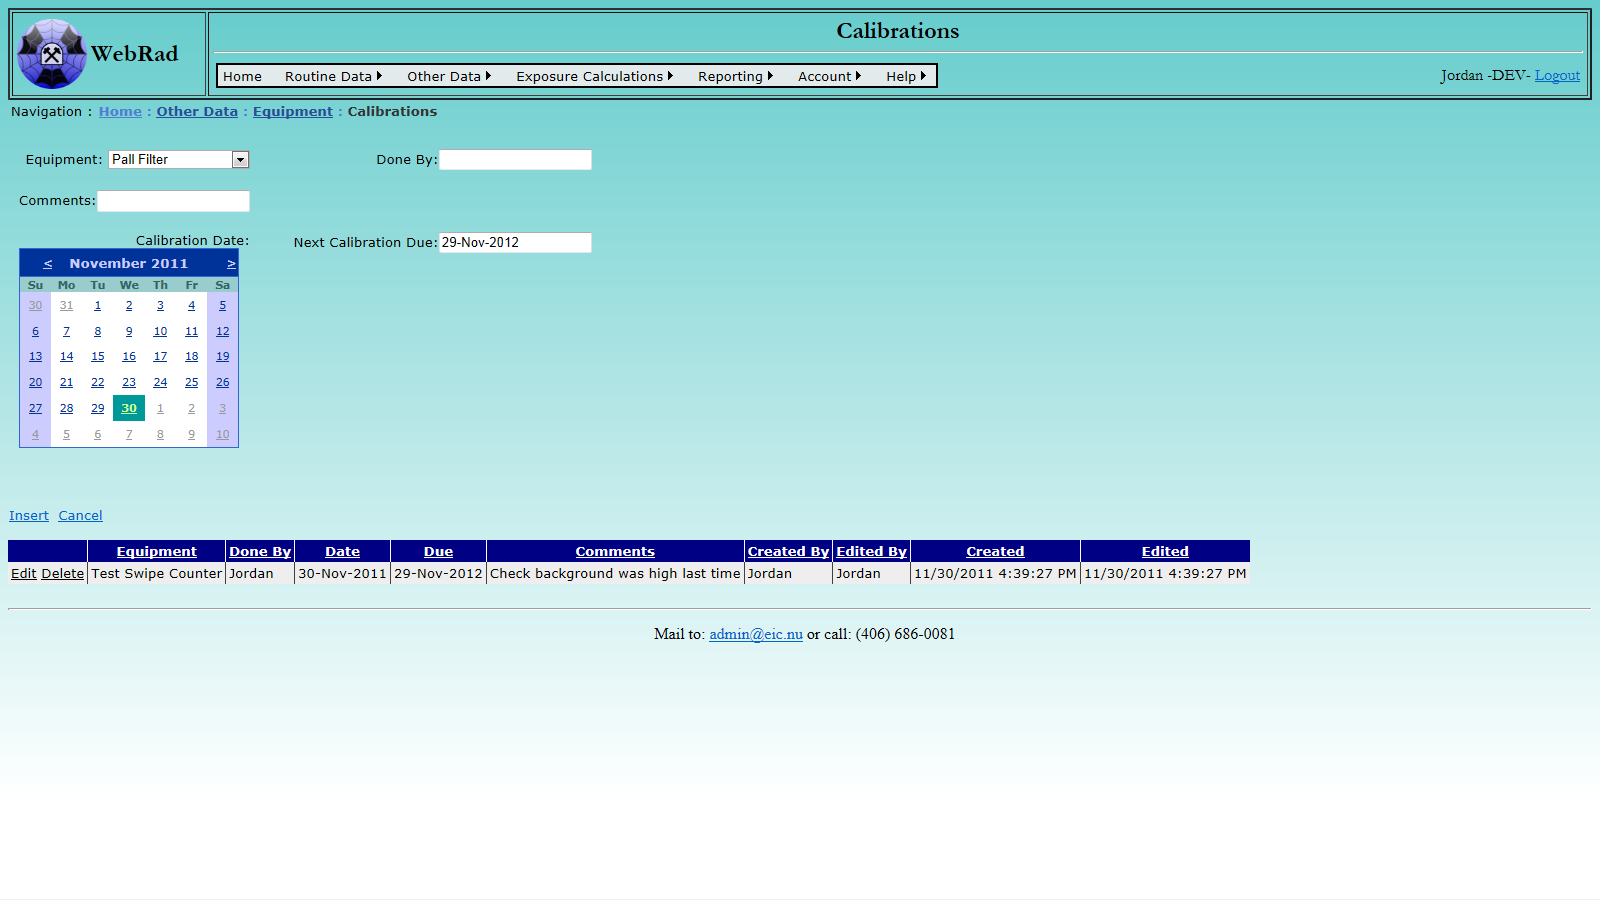
5.2.5 Entering Calibrations
At any time, calibrations can be logged for equipment. Mouse over "Other Data" on the menu bar, go down to "Equipment", go over and click on the "Calibrations" link. Click on "New Calibration Data". Select the Equipment Name from the drop down box and enter the name of the person or company who has done the calibration in the "Done By" box. By default the current date will be selected for the calibration date, this can be manually changed. The next calibration due date will automatically be set to the number of days specified by the selected equipment's Calibration Frequency after the calibration date.
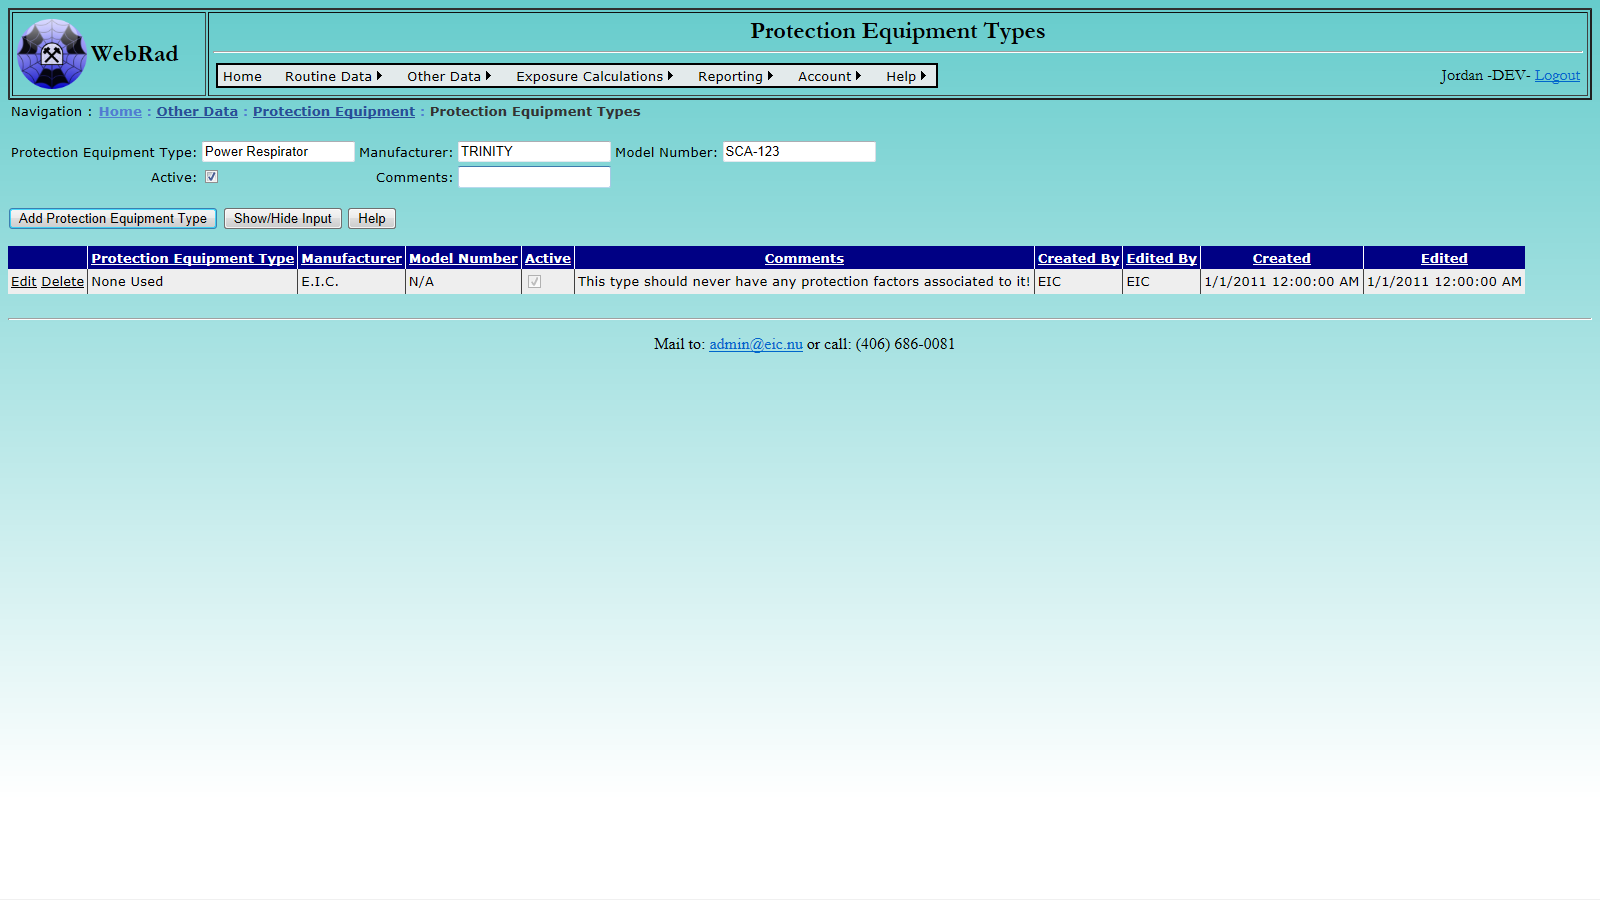
5.2.6 Entering Protection Equipment Types
Protection equipment is equipment such as respirators, which reduce a workers exposure to certain contaminants. The types of protection equipment which are stored in this table can be associated with employee time-card records to indicate that the employee was wearing that type of equipment during their hours logged. Set up your list of protection equipment types first by mousing over "Other Data" on the menu bar, go down to "Equipment", go over and click on the "Add Protection Equipment Type" link. Click on "New Protection Equipment Type". Enter the protection equipment type, its manufacturer, its model number and make sure the "Active" check box is checked. (Only "Active" protection equipment types show up in drop-down menus.) Click on "Insert". The new protection equipment type now shows up in the grid view.
Note: There are a few protection equipment types set up by default, such as "None". These types should be left alone as they are required for things like the SAP time importer.
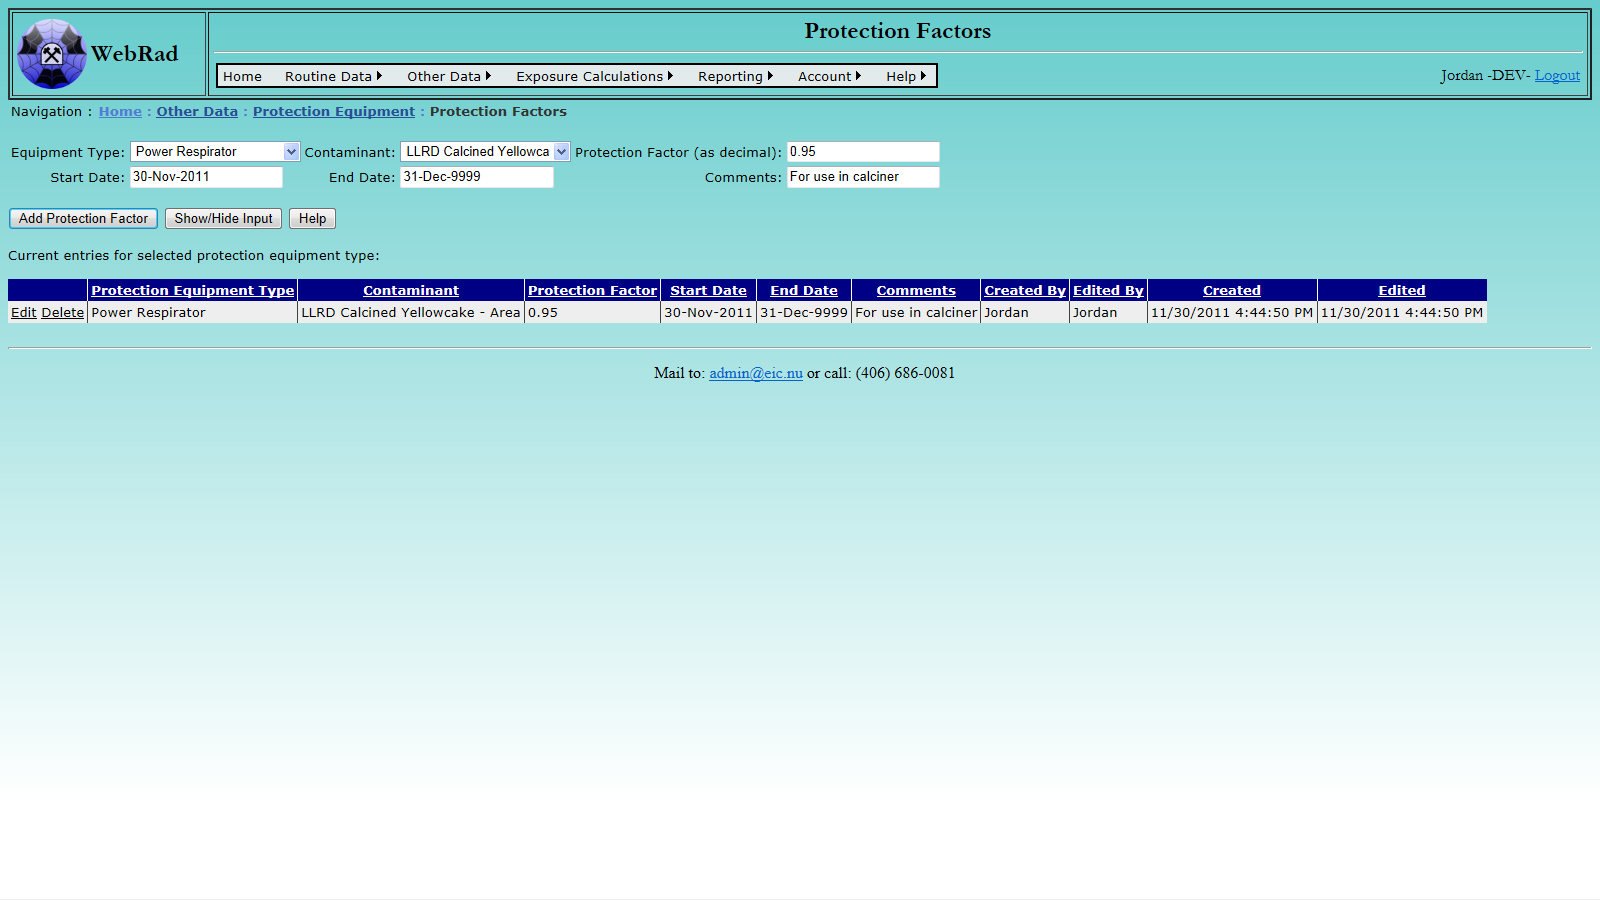
5.2.7 Entering Protection Equipment Factors
Next, set up your "Protection Factors". A protection factor is the factor by which exposure to a contaminant is reduced by using a given piece of protection equipment. Protection factors are assigned to a specific protection equipment type and a contaminant. A protection factor should be added for all contaminants effected by a protection equipment type. If not, exposure calculations for that contaminant will be the same as if the employee was not wearing any protection equipment. To add protection factors, mouse over "Other Data" on the menu bar, go down to "Equipment", go over and click on the "Protection Factors" link. Choose a protection equipment type from the drop down list. Once selected, any previously entered contaminants and their assigned protection factors will show up in the grid view below. To add a new protection factor, choose a contaminant, enter the protection factor and press the "Insert" button.
6. Contaminants Setup
6.1 Contaminant Information Structure
WebRad not only contains a number of contaminants already entered, but allows users to enter their own contaminants. These user entered contaminants can have Direct Entry Readings (area readings) and Personal Readings entered for them. They can also have exposure calculations performed based on one of these two types of readings using a ranking system that selectively picks out which values to use for a day based on the magnitude of the rank.
6.2 Setting Up Contaminant Information
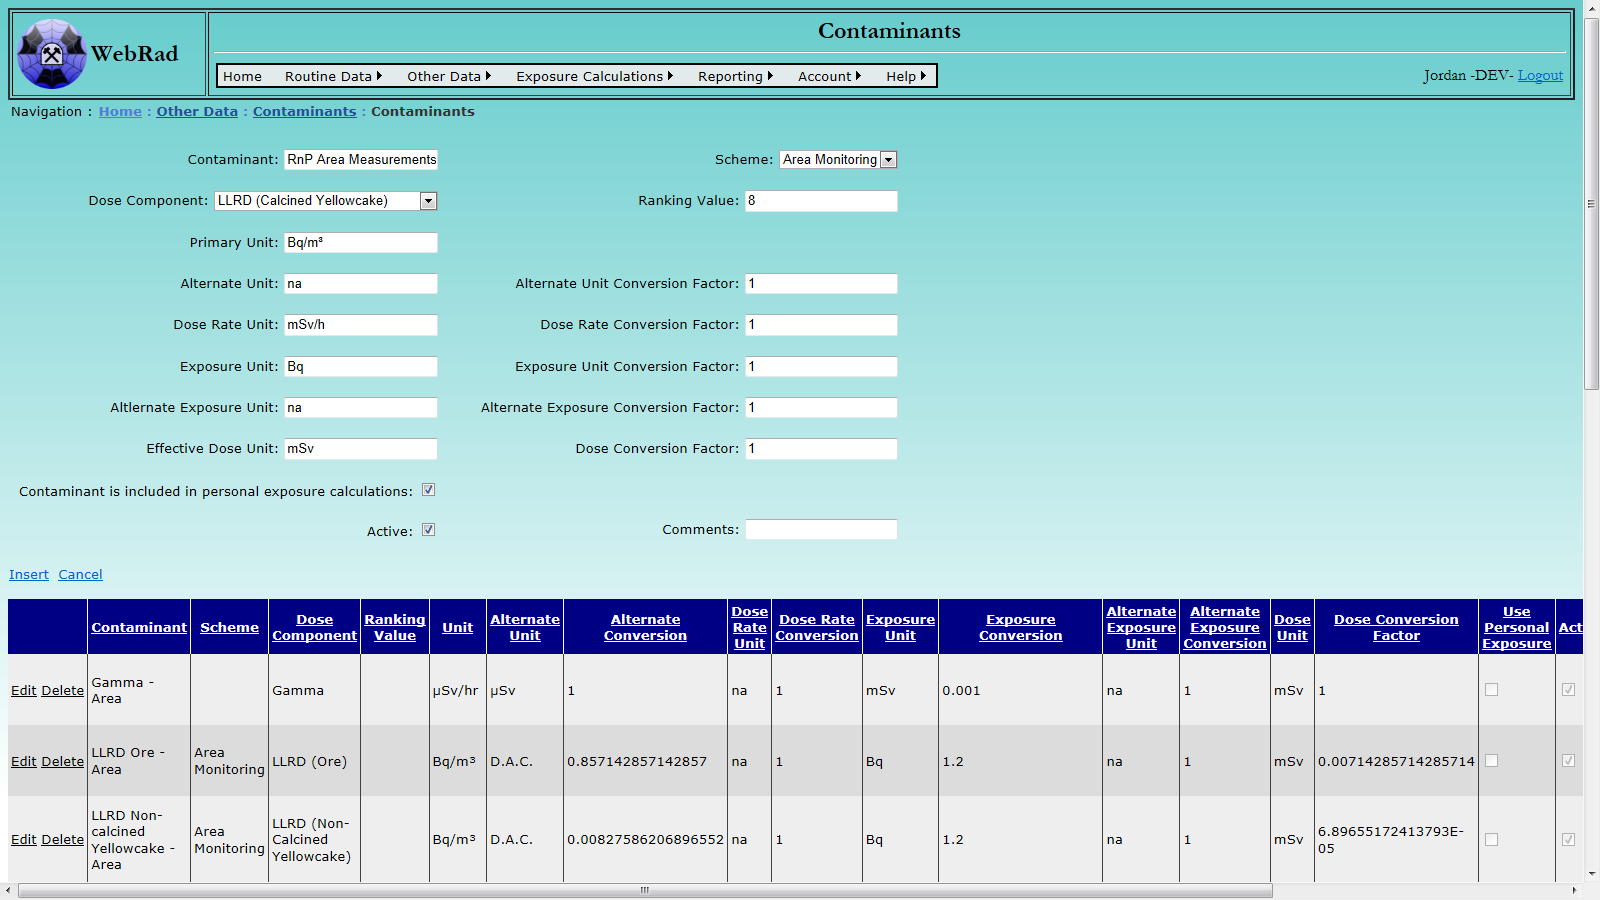
6.2.1 Entering Contaminants
Mouse over "Other Data" on the menu bar, go down to "Contaminants", go over and click on the "Contaminants" link. Click on "New Contaminant". Enter the name of the contaminant and the primary unit. This is the unit which Direct Entry Readings will be entered in. Alternate units, dose rate units, alternate exposure units and their respective conversion factors currently perform no function in the database, but are included to facilitate enhanced functionality in the future.
Enter the exposure unit and exposure unit conversion factor. This is the unit that will be used to convert the values stored in the database to an exposure. In the case that the contaminant is being used for Personal Readings, this will be the value that is multiplied against the Rersonal Reading value stored in the data base to get an exposure. In the case that it is used for Area Time Occupancy, this is the value that will be multiplied by the hours spent in the area and average area concentration to get the exposure. Below are the two formulas for each case.
(Using with Personal Exposure) Exposure = Personal Reading Value * Exposure Conversion Factor
(Using without Personal Exposure) Exposure = Area Reading Value * Hours * Exposure Conversion Factor
Enter the effective dose unit and conversion factor. The same effective dose unit should be used for all contaminants, by default this is mSv. The dose conversion factor is used to calculate dose from exposure by the formula:
Effective Dose = Exposure * Dose Conversion Factor
Check the "Contaminant is included in personal exposure calculations" if you want to use the contaminant to enter Personal Dosimetry Readings and have them used for exposure calculations. Leave it unchecked if you want to use the contaminant to record area levels or task levels. If you want readings for this contaminant to be used to create dosimetry area values you must pick a scheme for the contaminant. Dosimetry areas using this same scheme will get average levels created for that contaminant. Time cards can then be assigned to those Dosimetry areas and exposures can be generated.
Note: In the case that you wish to have a new contaminant used to generate exposure values you must give the contaminant a rank and select a dose component other than "none". The rank is used in exposure calculations to selectively pick which pathway is taken to generating dose for a given day when there are multiple ways. The lower the rank, the higher its priority. Identical ranks allow for multple pathways to be summed together if they are the lowest for the day.
Make sure that the "Active" check box is selected so the Contaminant will show up in drop down where appropriate. Deactivating a contaminant does not stop the exposure calculations from using it. This would be accomplished by setting its Dose Component to a value of "None".
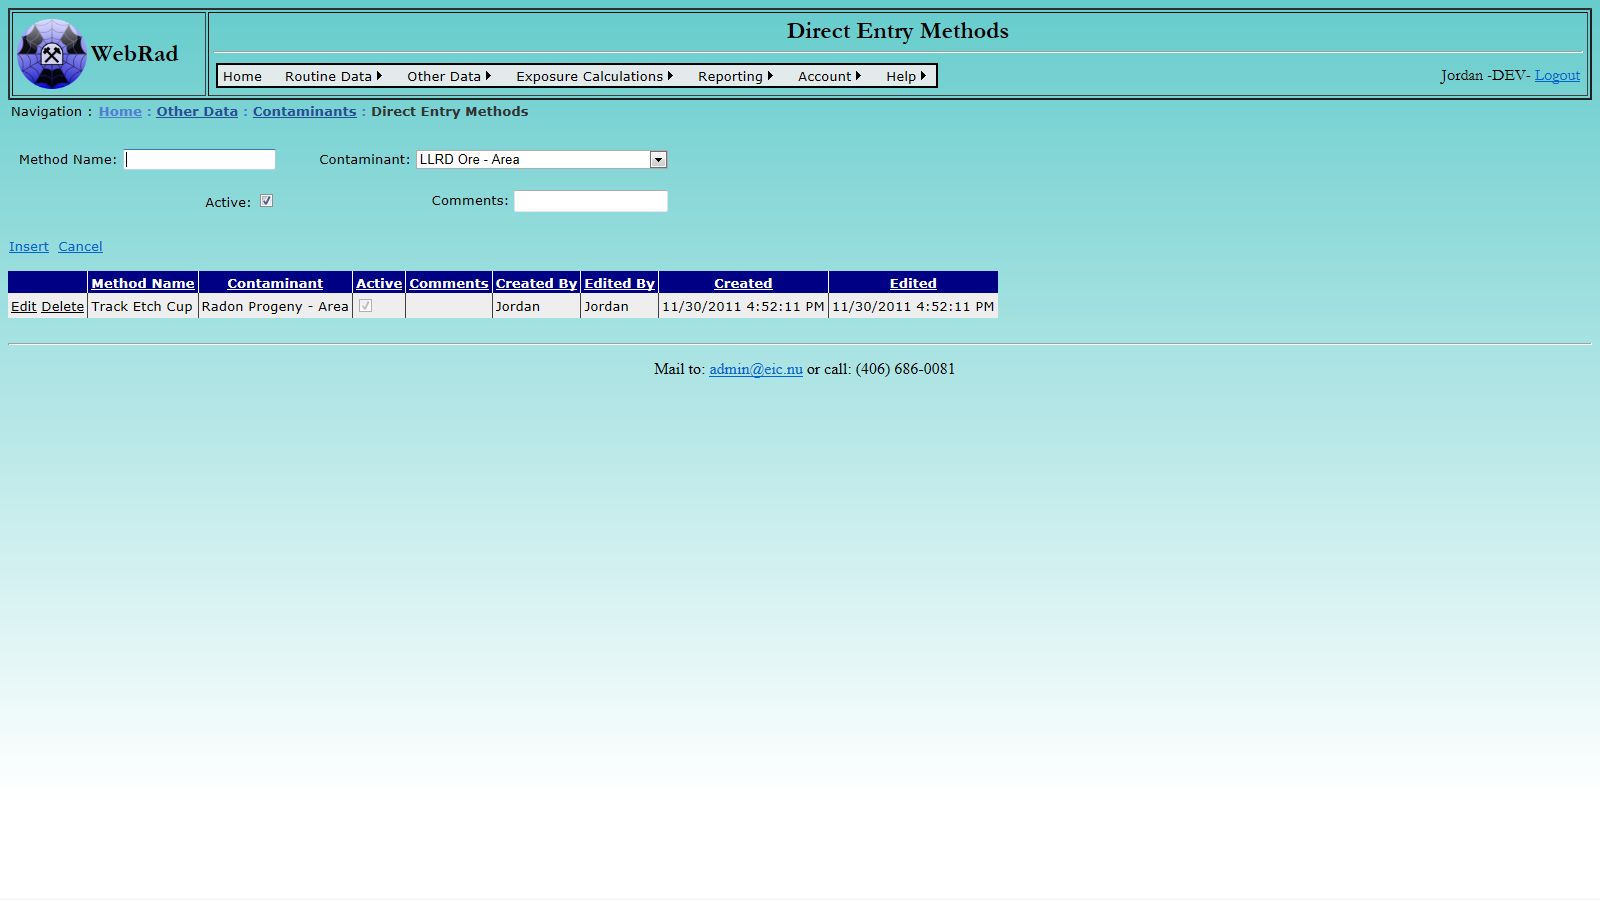
6.2.2 Entering Direct Entry Methods
Direct Entry Methods allow contaminant concentrations to be entered into the database using the contaminants "primary unit". For example, if you set up radon gas as a contaminant and defined its primary unit as Bq/m^3, then the Direct Entry Method will ask you to enter radon gas concentrations in Bq/m^3. Other data entry screens can be built, which convert between the units displayed on a particular instrument and the contaminant's primary unit. However, this process is more complicated.
To add a new Direct Entry Method, mouse over "Other Data" on the menu bar, go down to "Contaminants", go over and click on the "Add Direct Entry Method" link. Click on "New Direct Entry Method".
Enter a name and choose the contaminant from the drop down box. This name is what will appear in the drop down box on the "Direct Entry Readings" page, so make sure it is clear what contaminant it is refering to.
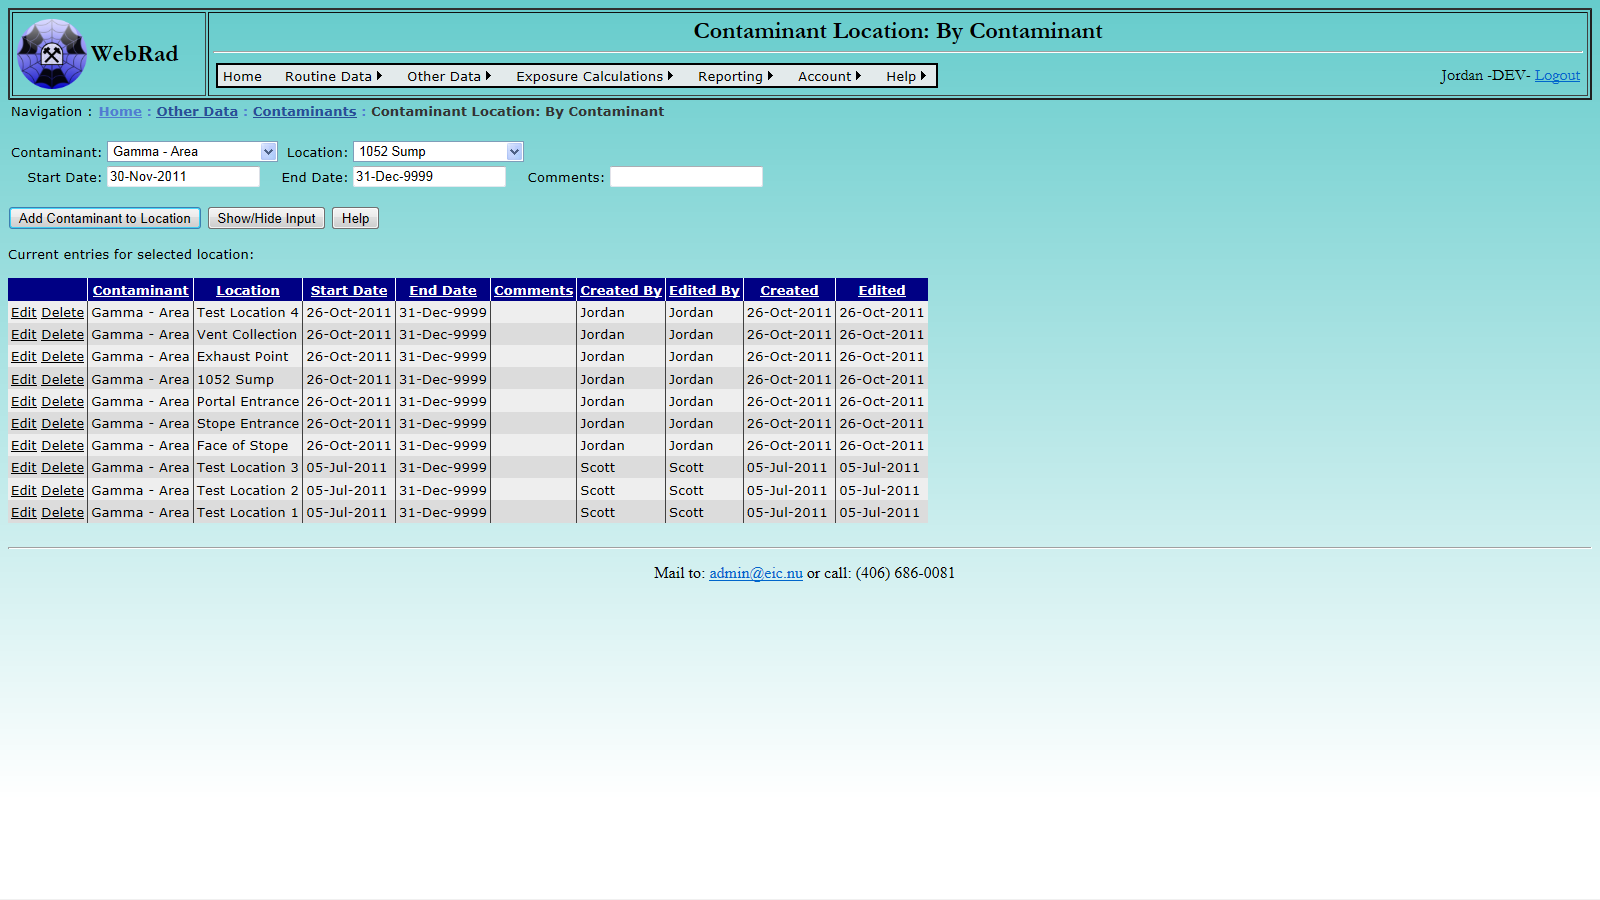
6.2.3 Choosing Locations
One contaminant can be associated with one or many different locations. Also, one location can have one or many different contaminants. To setup the locations associated with a contaminant, Mouse over "Other Data" on the menu bar, go down to "Contaminants", go over and click on the "Contaminant Location: By Contaminant" link.
To show the locations of a specific contaminant, select the contaminant name from the "Contaminant" drop down box. The grid view will be refreshed to show all of the locations associated with that contaminant, and their corresponding usage date ranges. At this point additional locations may be added for a contaminant for a given date range, or date ranges may be edited straight from the grid view below. To add a new location and date range, select the location from the "Location" drop down box and pick a date range for the contaminant to be associated to that location. Note that date ranges for a specific contaminant must be unique and are not allowed to overlap. If this does happen you will get an error message and the record insertion will fail. The default date for the end date is set to December 31, 9999. If you wish to stop a contaminant on a certain date, you must modify its record using the "Edit" button and set the end date to an appropriate point in time.
6.3 Contaminants Concentration Readings Entry Structure
WebRad can be configured to keep track of any number of contaminants. Here, we describe how to enter the preconfigured LLRD, Radon Progeny entries, and Contamination Control Swipes, as well as user added contaminant entries.
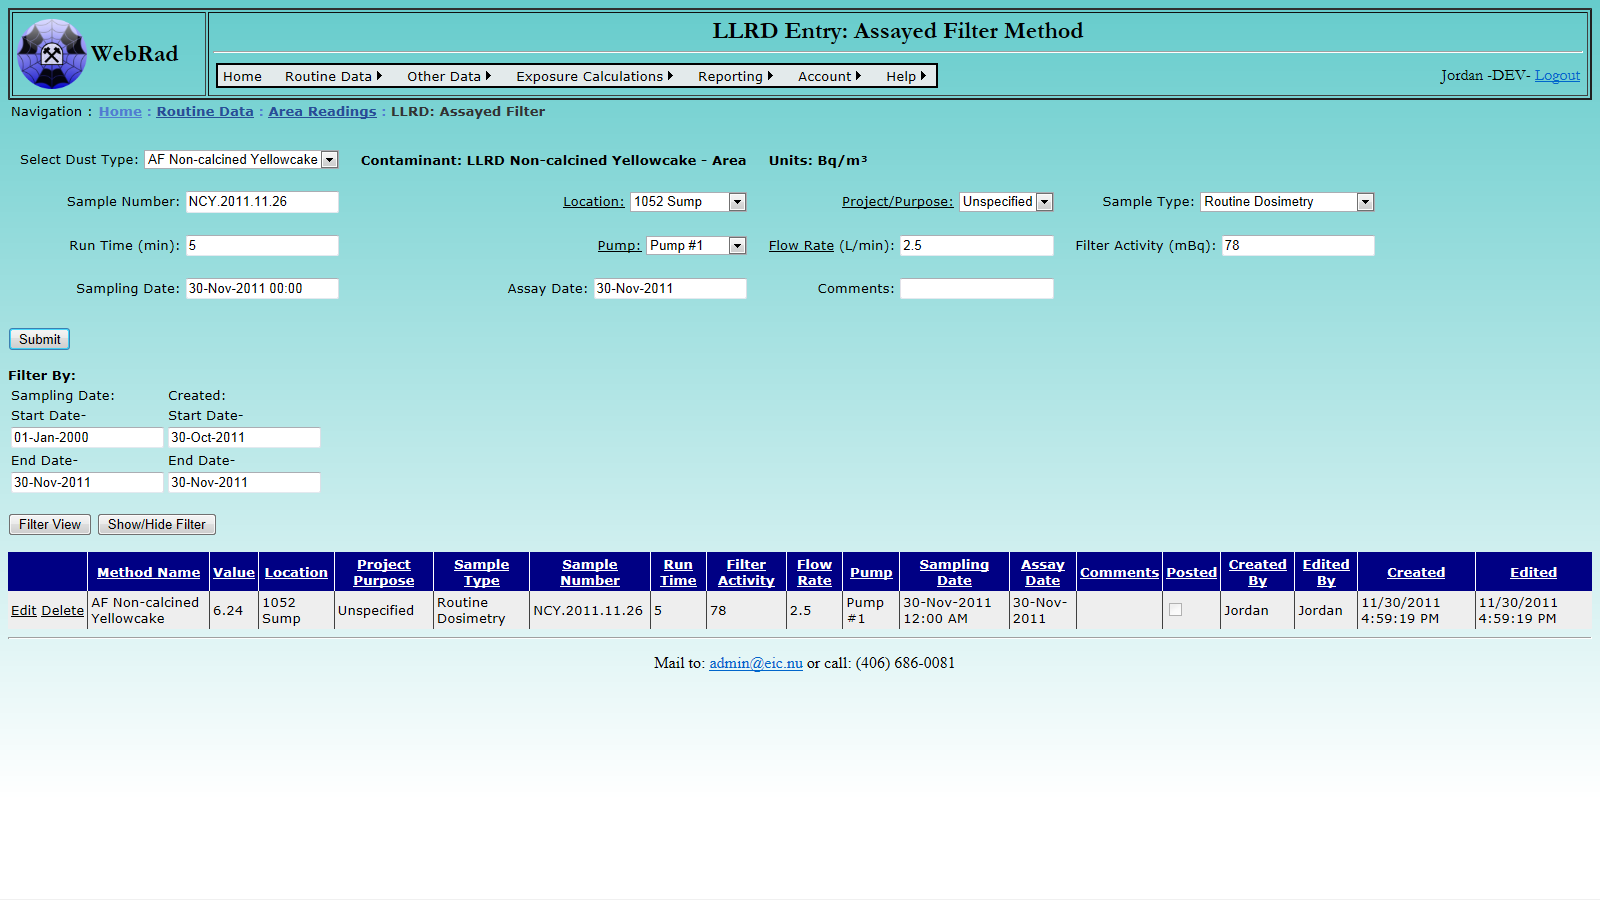
6.3.1 Entering LLRD By Assayed Filter Method
Mouse over "Routine Data" on the menu bar, go down to "Area Readings", go over and click on the "LLRD: Assayed Filter" link. Select the type of dust from the drop down box Enter a sample number (if applicable). Select the Sample Location from the drop-down box. Select the Sample Type and associated Project Purpose (if any).
Enter how long the sample pump was running, in minutes, and select which pump was used. The program will automatically find the most recent flow rate of the pump. The user can change this value by simply editing the text box.
Enter the activity on the filter in the unit specified. Enter the date and time of the sample. Today's date is shown by default and the user has to enter the time in 24 hour format. Enter the assay date (if applicable).
Once you hit "Submit", your data is used to calculate a value (the units of which are shown at the top by the label "Units") which is then saved into the database. The form will then re-loads with the same values. This is intended to save some typing. Only hit "Submit" once, otherwise the same entry will show up in the database twice. At the end of a data entry session, you should read through the data in the grid view and delete any inadvertent entries or entries in which the calculated data seems incorrect.
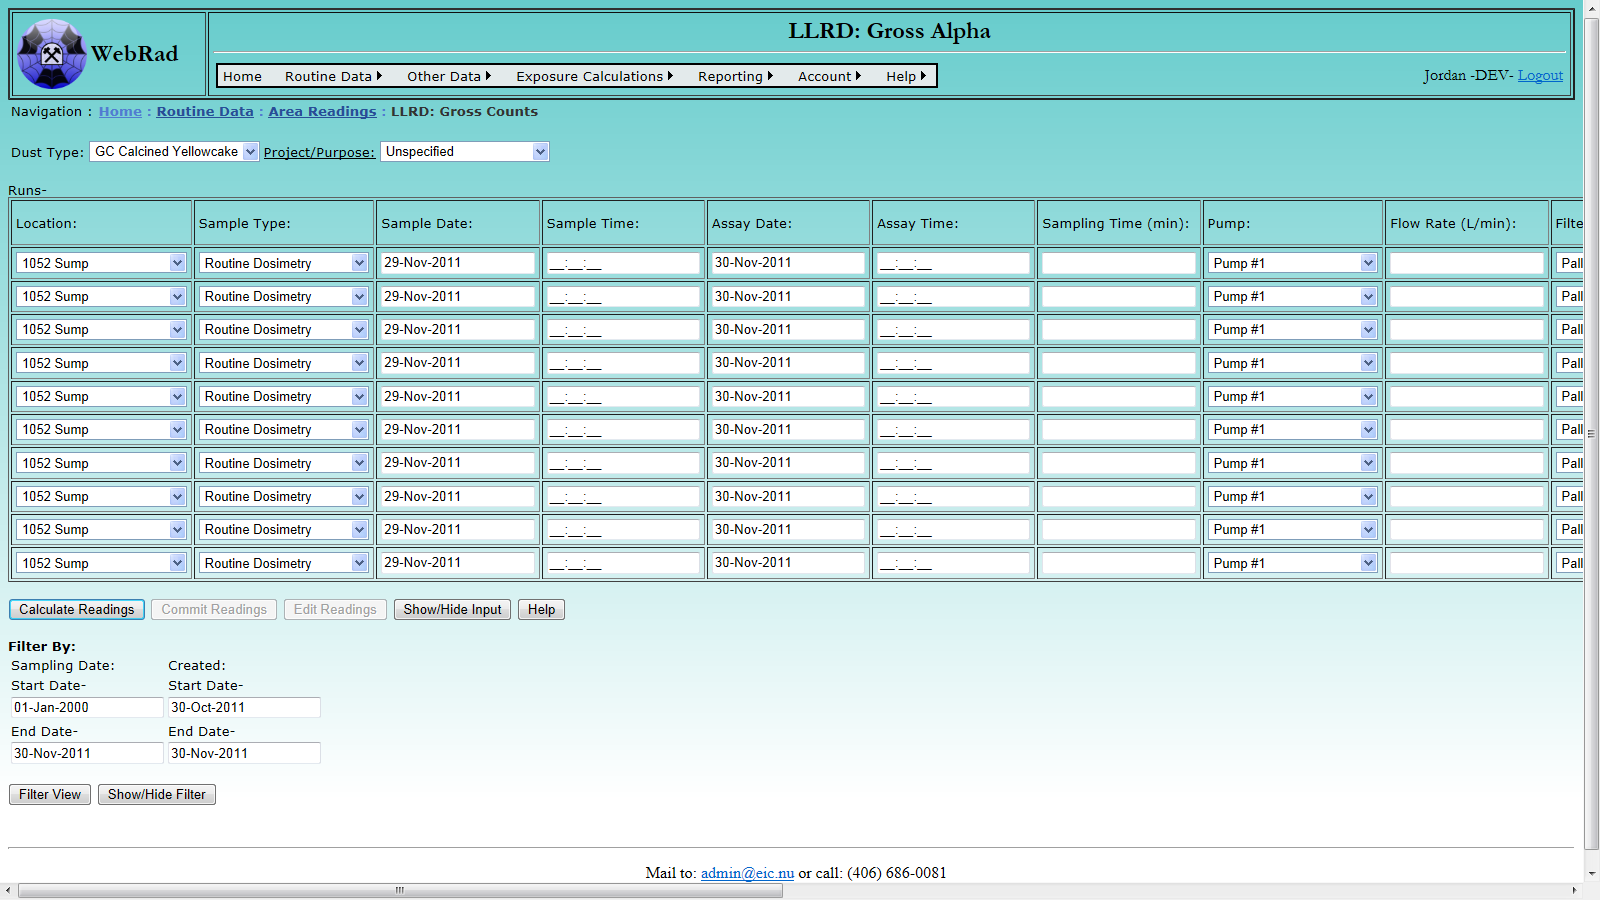
6.3.2 Entering LLRD by Gross Counts
Mouse over "Routine Data" on the menu bar, go down to "Area Readings", go over and click on the "LLRD: Gross Counts" link. This bulk entry interface allows for up to 10 LLRD readings to be entered at once.
First enter the setup information on the top of the page. Select the type of dust corresponding to the entries from the "Dust Type" drop down box. Select any special Project or Purpose (if any) with which the samples are associated.
Next enter the data for each individual reading. Note that a seperate entry will be made for each run. Choose the location of the run. Select the appropriate Sample Type. Next, enter the date that the sample was taken as well as the time in 24 hour format. Enter the assay date and the time in 24 hour format. Enter the sampling time of the run in minutes.
Select the pump that was used. A flow rate parameter can be entered manually in L/min. If no flow rate parameter is entered when readings are calculated, the latest flow rate parameter for the pump will be pulled in if it exists. If no such parameter has been entered (this is done on the equipment "Parameter Values" page) and none is manually entered by the user, then an error message will appear prompting you to edit the readings and enter it.
Select the filter that was used. A self absorption factor can be entered manually. If no self absorption factor is entered when readings are calculated, the latest self absorption factor for the filter will be pulled in if it exists. If no such parameter has been entered and none is manually entered by the user, then an error message will appear prompting you to edit the readings and enter it.
Enter the gross counts for the run as well as the sample count time in minutes. Then enter the background counts as well as the background count time in minutes.
Select the counter that was used. An efficiency can be entered manually. Note that efficiency should be entered as a decimal value rather than a percent. If no efficiency is entered when readings are calculated, the latest efficiency parameter for the counter will be pulled in if it exists. If no such parameter has been entered and none is manually entered by the user, then an error message will appear prompting you to edit the readings and enter it.
Enter any comments about the run.
Once all necessary runs have been entered click the "Calculate Readings" button. If there are no errors for your entries, then a reading will be calculated and displayed in Bq/m3 for each run. If you wish to make changes to your data click the "Edit Readings" button to cancel the current reading and allow you to edit your data. Once you are happy with your current readings, click the "Commit Readings" button. All successfully committed readings will be removed from the list of runs.
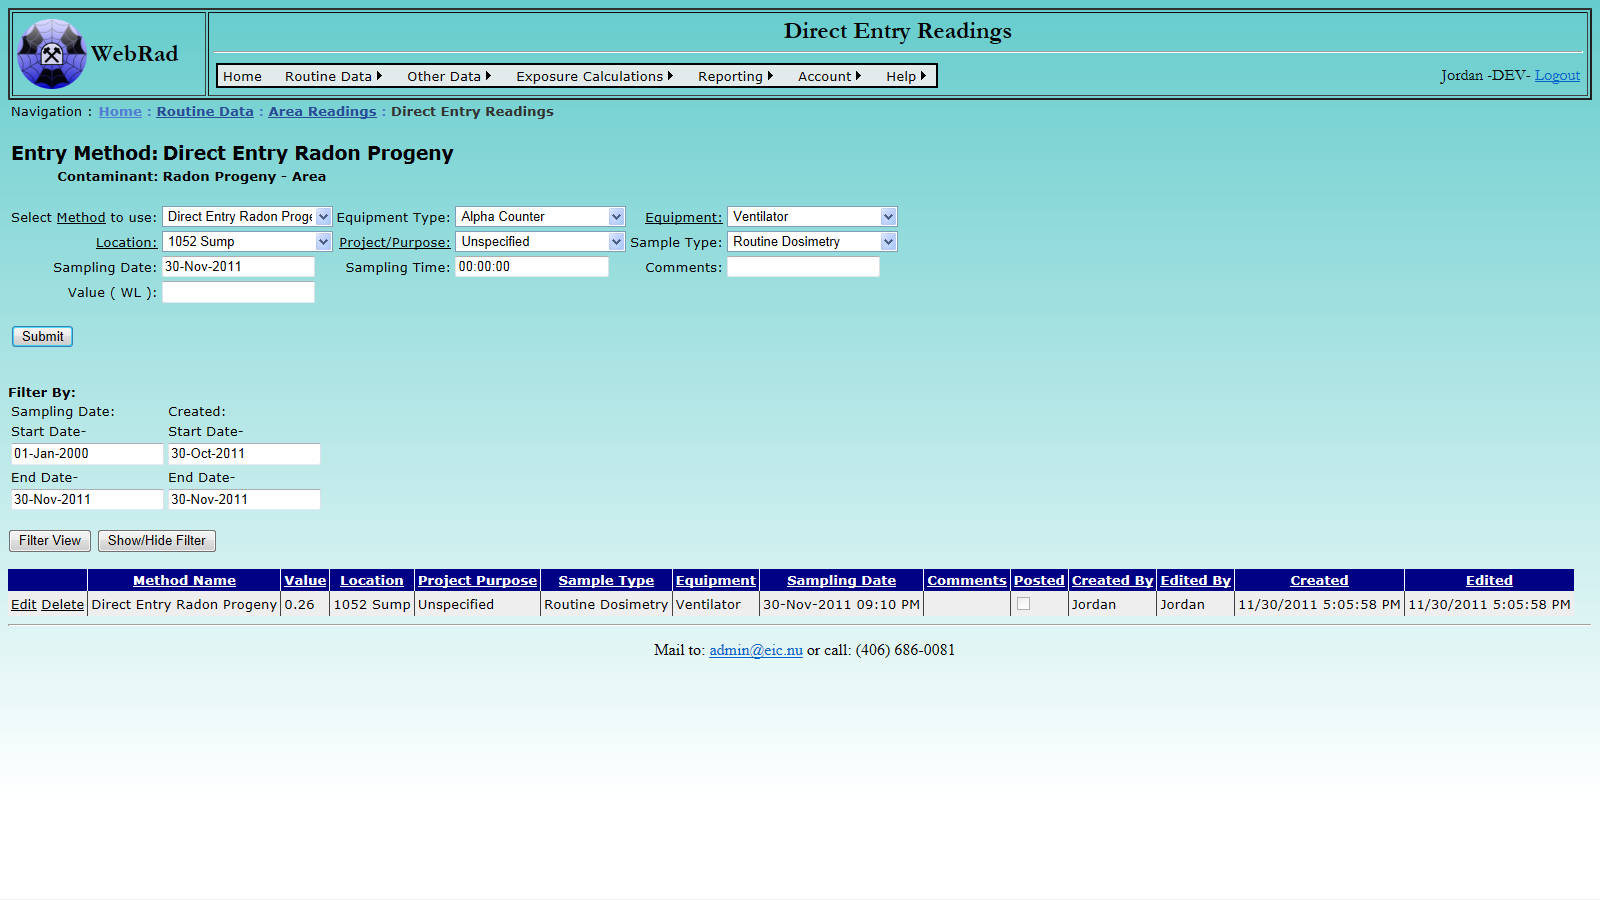
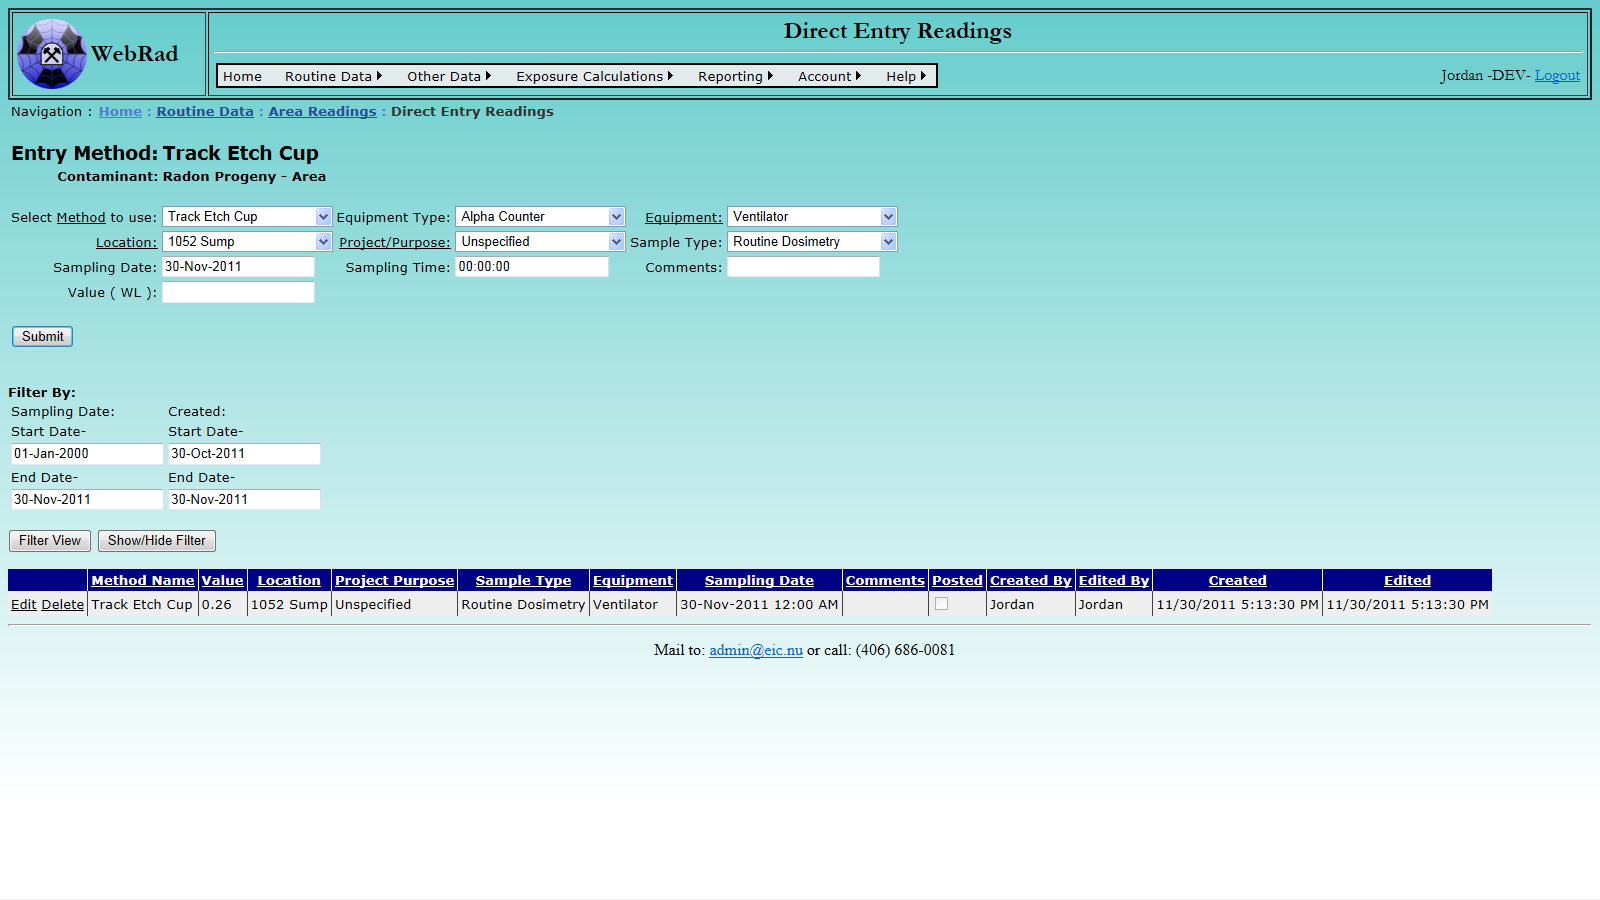
6.3.3 Entering Radon Progeny By Direct Entry Method
Mouse over "Routine Data" on the menu bar, go down to "Area Readings", go over and click on the "Direct Entry Readings" link. Select "Radon Progeny Direct Entry" from the "Select Method to use" drop down box. Enter the radon progeny concentration in WL in the "Value" field.
Select the sample location from the drop-down box. Select the sample type and project purpose if required.
Enter the date and time (in 24 hour format) of the reading and any comments and hit "Submit" to store the data. The new entry, complete with calculated WL, now shows up in the grid view. The entry can be deleted from the database by clicking the Delete link in the grid view. To edit the new and any old entries click the "Edit/Filter Readings" button.
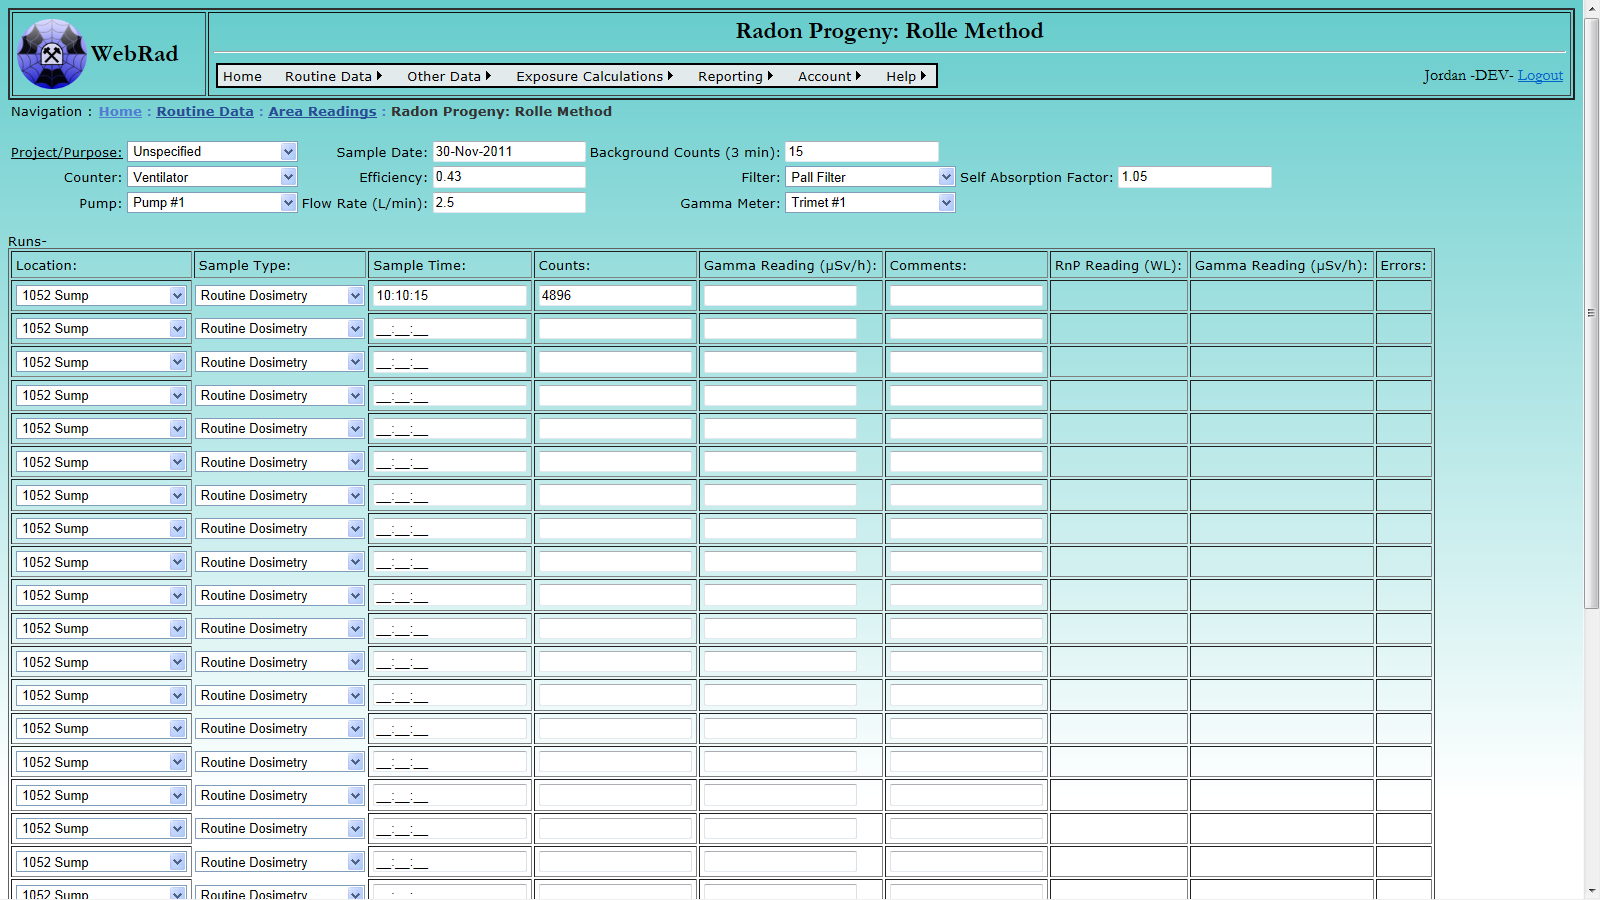
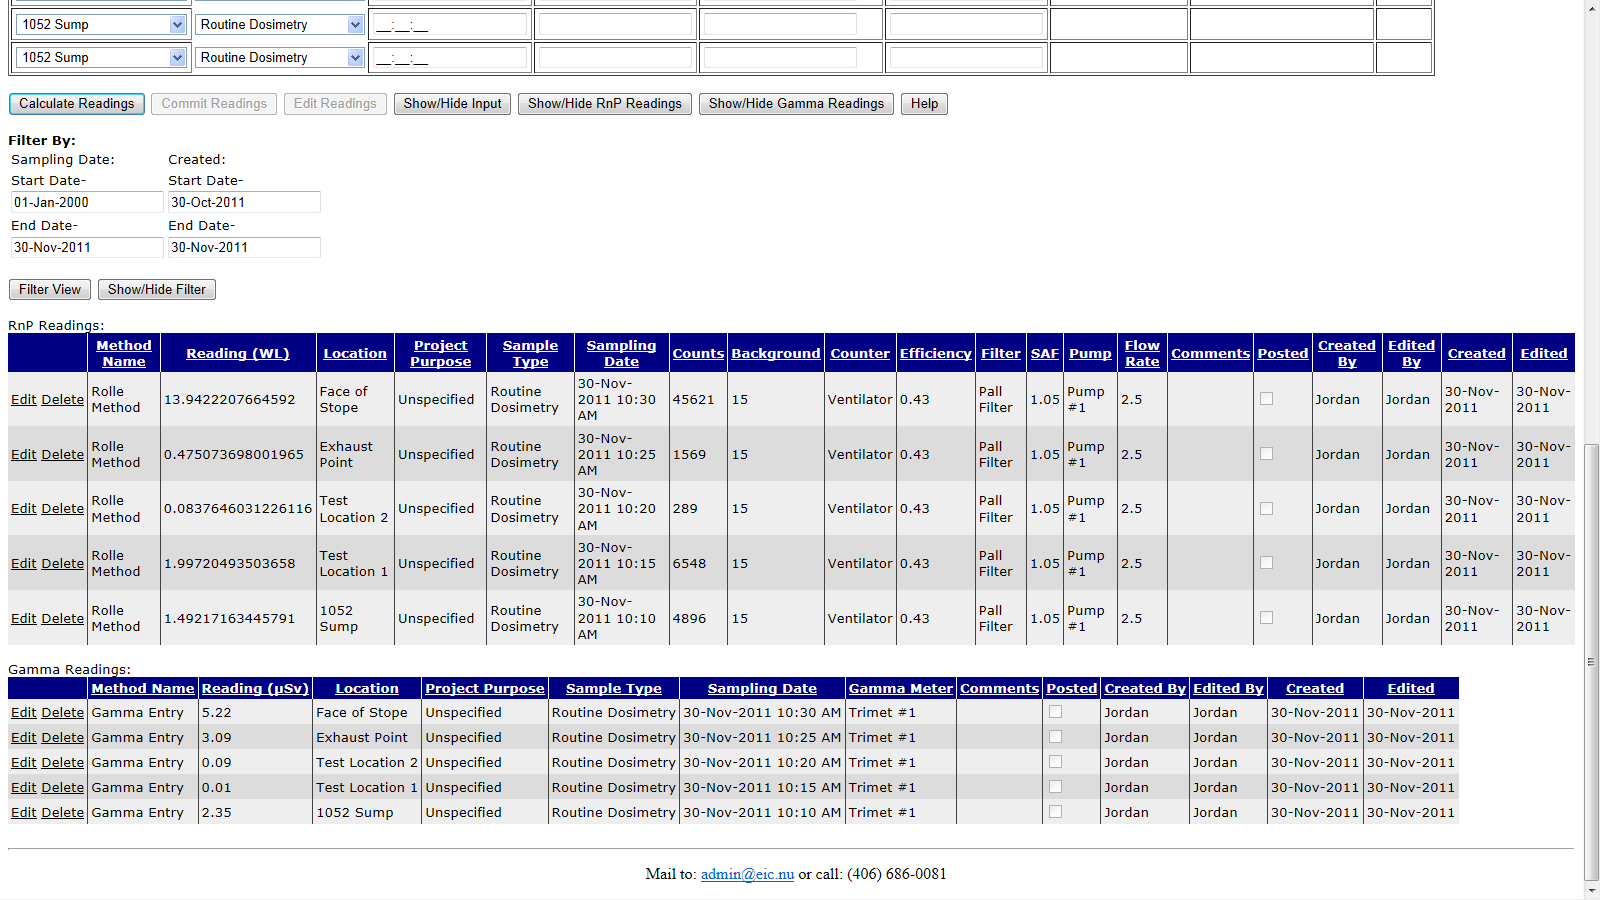
6.3.4 Entering Radon Progeny By Rolle Method
Mouse over "Routine Data" on the menu bar, go down to "Area Readings", go over and click on the "Radon Progeny: Rolle Method" link.
This bulk entry interface allows for up to 20 radon progeny (with optional gamma) readings to be entered at once. All simultaneous entries must be on the same sampling date and use the same equipment.
First enter all the setup information on the top of the page.
Select any special Project or Purpose (if any) with which the samples are associated. Select the appropriate Sample Type. Enter the date that the samples were taken. Enter the number of background counts.
Select the counter that was used. Once selected, the latest efficiency parameter (as entered on the equipment "Parameter Values" page) will automatically be pulled in. If no efficiency parameters have been entered then you will need to manually enter the counter efficiency. Note that efficiency should be entered as a decimal value rather than a percent.
Select the filter that was used. Once selected, the latest self absorption factor parameter will automatically be pulled in. If no self absorption factors have been entered then you will need to manually enter it.
Select the pump that was used. Once selected, the latest flow rate parameter will automatically be pulled in. If no flow rate parameters have been entered then you will need to manually enter it in L/min.
If you need to enter gamma readings along with the radon progeny readings then select a gamma meter.
Next enter the data for each individual reading. Note that a seperate entry will be made for each run (or two if the run also has a gamma reading).
Choose the location of the run. Enter the time in 24 hour format. Enter the counts. If you need a gamma reading for the run as well, then enter the gamma reading in uSv.
Enter any comments about the run.
Once all necessary runs have been entered click the "Calculate Readings" button. If there are no errors for your entries, then a reading will be calculated and displayed in working levels for each run. Note that any run lines which do not have data entered will recieve error messages. You may disregard these as they will not prevent the entry of the lines which did have a reading value successfully calculated.
If you wish to make changes to your data click the "Edit Readings" button at the bottom of the bulk entry form to cancel the current reading and allow you to edit your data. Once you are happy with your current calculated readings, click the "Commit Readings" button. All successfully committed readings will be removed from the list of runs.
Note that radon progeny readings and gamma readings are stored seperately, and are displayed for deleting in two seperate grids. To edit the new and any old entries for both radon progeny and gamma readings click the "Edit Old Readings" button. You can optionally show or hide either of these two grid views using the show buttons at the bottom.
6.3.5 Entering User Added Contaminant Readings By Direct Entry Method
Mouse over "Routine Data" on the menu bar, go down to "Area Readings", go over and click on the "Direct Entry Readings" link. Select the name of the Direct Entry Method you have added for the desired contaminant from the "Select Method to use" drop down box. Enter the reading value in the "Value" field. The unit of this value should automatically appear when the Method is selected.
Select the Sample Location from the drop-down box. Select the Sample Type. Enter the date and time (in 24 hour format) of the reading and any comments and hit "Submit" to store the data.
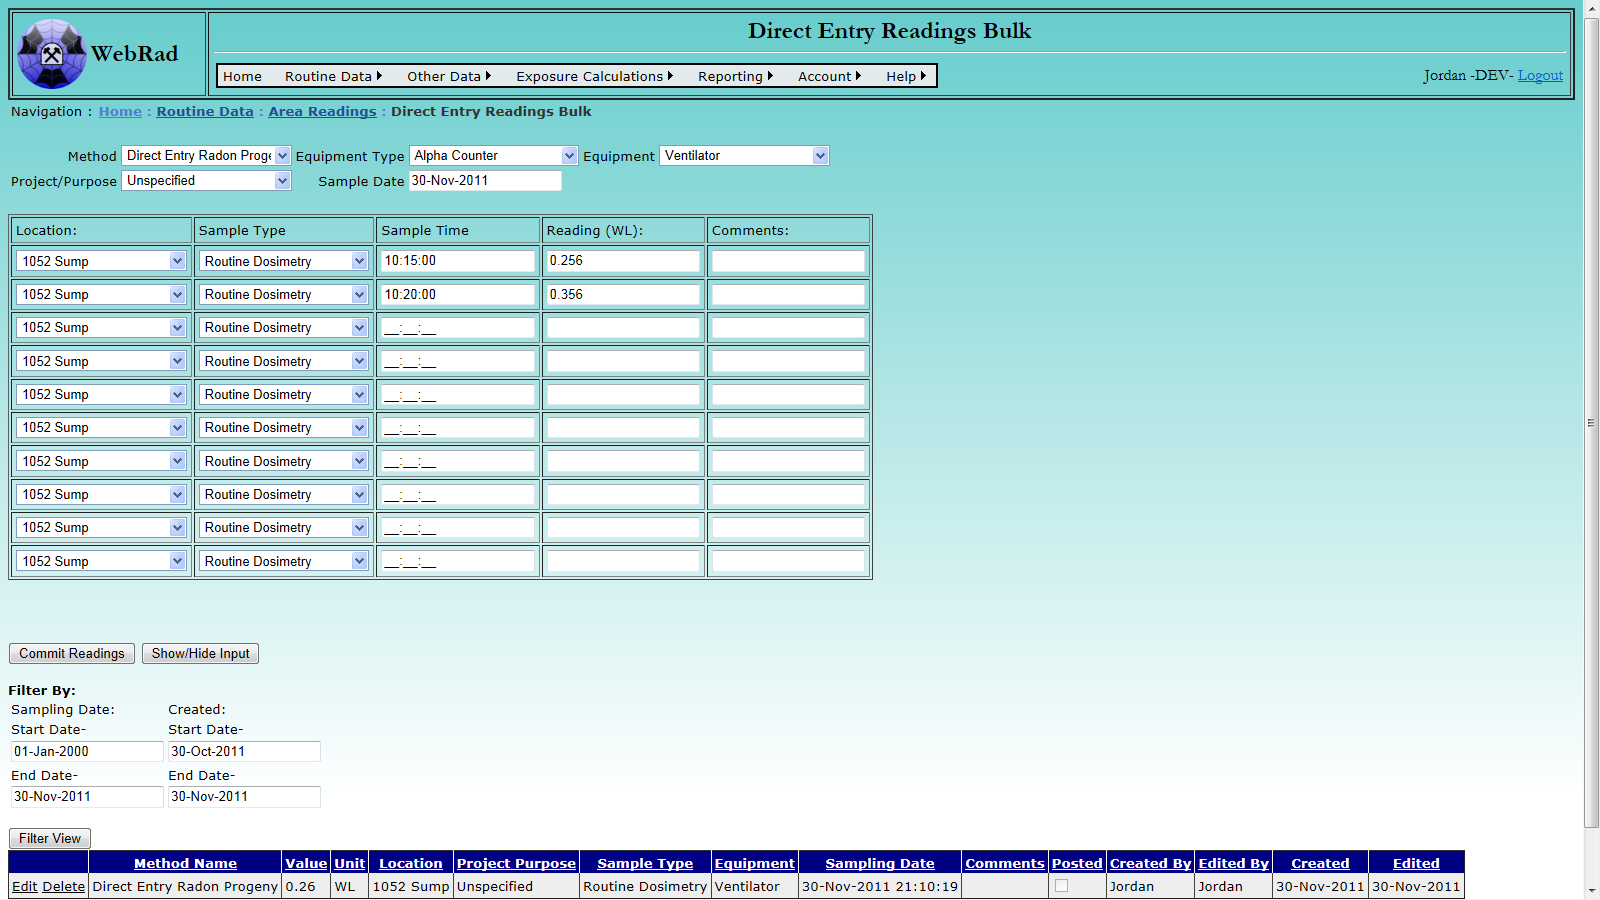
6.3.6 Entering User Added Contaminant Reading By Bulk Direct Entry Method
Mouse over "Routine Data" on the menu bar, go down to "Area Readings", go over and click on the "Direct Entry Readings Bulk" link. Select the name of the Direct Entry Method you have added for the desired contaminant from the "Method" drop down box. Select the "Equipment" which was used to record all of the readings. Specify the "Project Purpose" of the readings. Select the appropriate "Sample Date" which the readings were taking on. For each row in the bulk entry table, select a Location and Sample Type from the drop down boxes. Enter a Sample Time and Reading Value as well as any associated comments. Once all readings have been entered select the "Commit Readings" button to load the values into the database. The grid view below will repopulate with the recently added data.
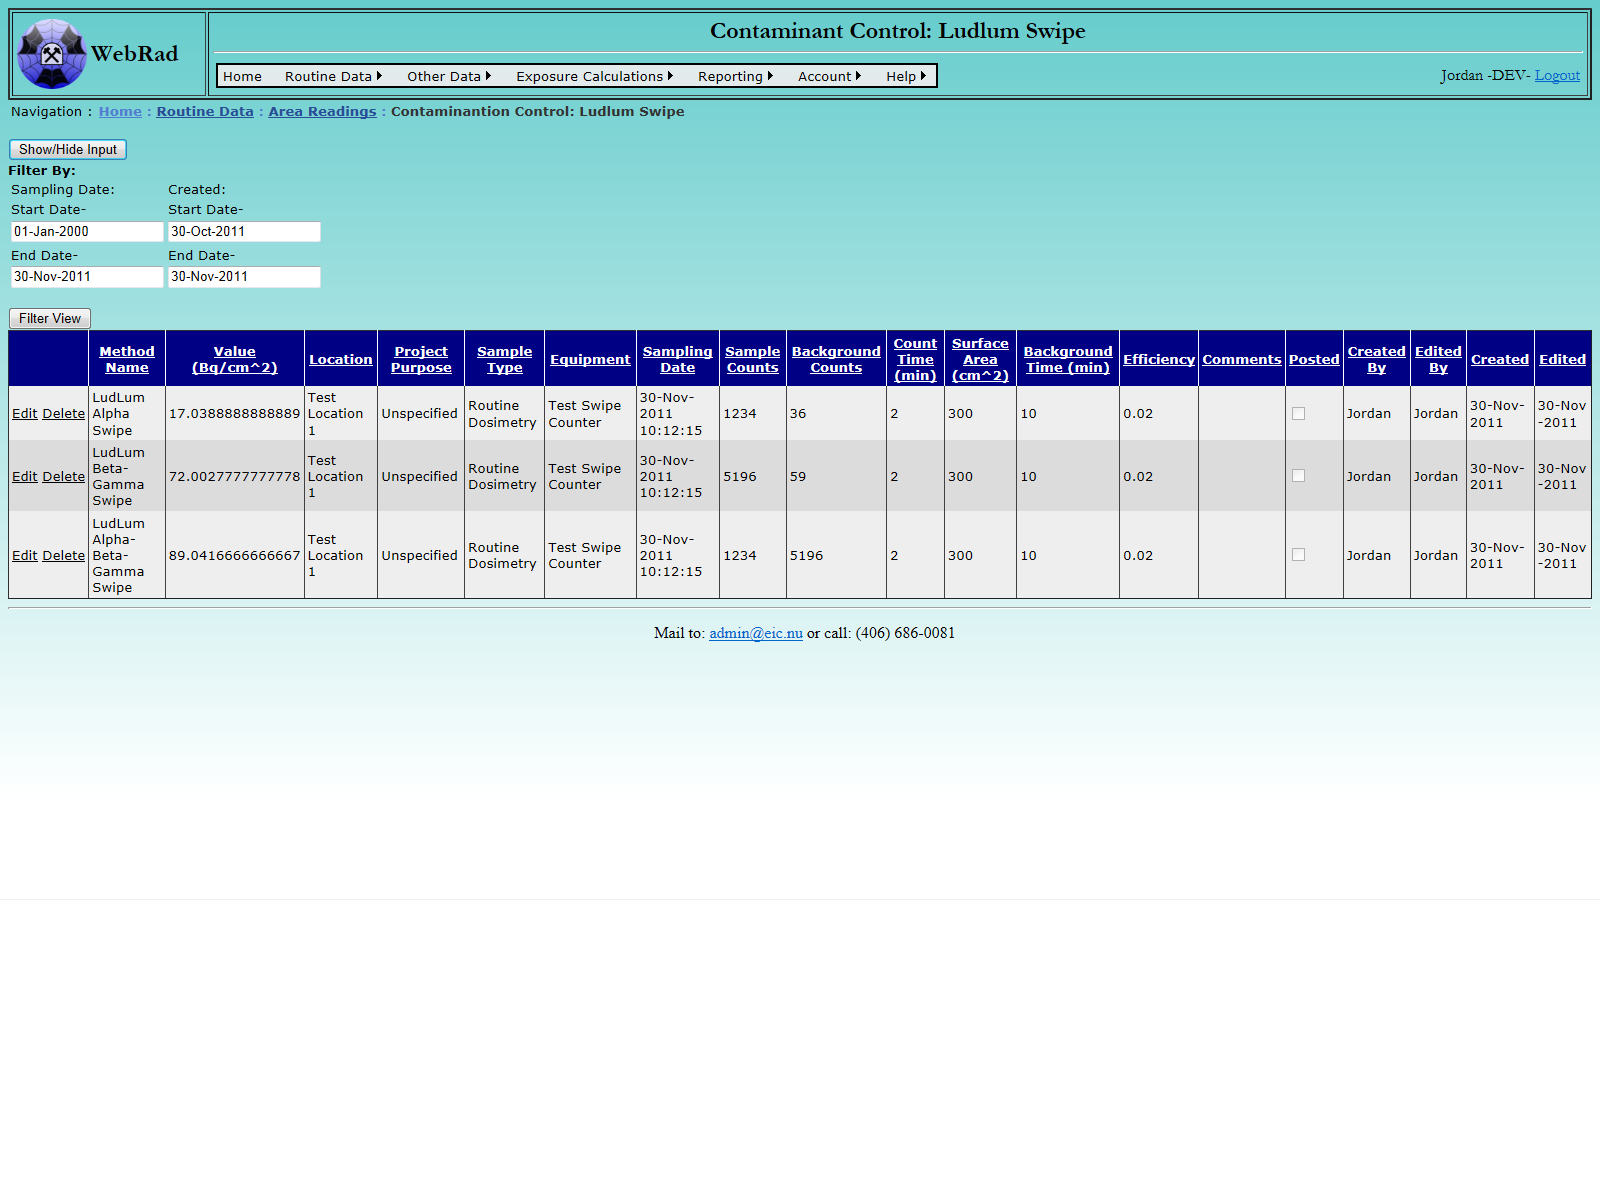
6.3.7 Entering Contamination Control Swipes
The contamination control swipe module allows users to enter mutiple swipe samples for a given day and piece of equipment.
Mouse over "Routine Data" on the menu bar, go down to "Area Readings", go over and click on the "Contaminations Control Swipe" link. From the equipment drop down box, select the instrument that the readings were made with. Note that only equipment of type "Swipe Counter" will appear in this drop down. After a piece of equipment is select, the Alpha efficiency and Beta-Gamma efficiency will automatically be populated by the most recent values from the equipment parameters table. However, these values can be replaced with whatever is desired. Select a date for the samples, followed by appropriate "Sample Type" and "Project Purpose".
Enter the Alpha background counts, Beta-gamma background counts, and the time for which the background was counted. Next enter the surface area being analyzed (default is set to 300cm2). Make sure to also include the count time for samples being measured.
Now that all of the setup data is entered it is time to enter the individual readings. Each row in the bulk table will calculate three records which can be loaded into the database; an Alpha reading, a Beta-Gamma reading, and a total reading. These values are calulated as soon as all required data exists for a given row. The required data includes a selected location, an Alpha count, a Beta-Gamma count, and a valid time of day. When moving to a different row, missing data will be highlighted in red to indicate it is required.
Once all data is entered click on the "Commit Readings" button to enter the records. When the page reloads, all successfully entered rows will be cleared leaving only the rows with errors.
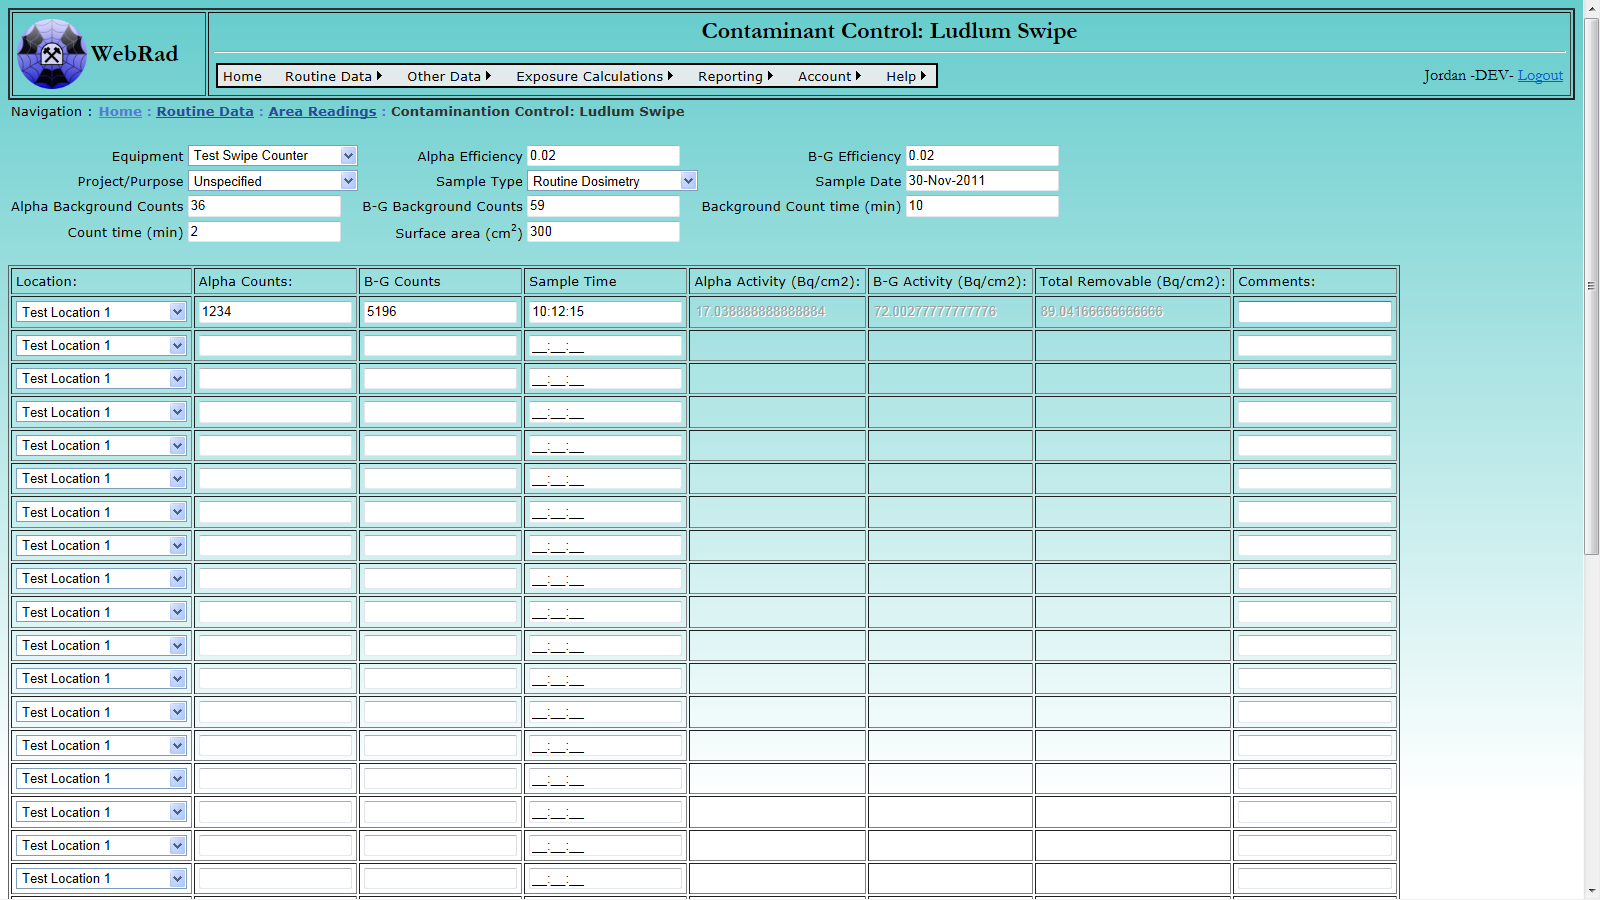
A grid view is supplied below to modify and delete records. Due to the large amount of locations on the webpage, it helps to hide the input (using the "Show/Hide Input" button) to make the page load faster. It should also be noted that when removing a single swipe record, all three of the records should be removed at once (Alpha,Beta-Gamma,Total).
Special Note: The columns for the total record represent the following: Sample Counts = Alpha Counts, Background Counts = Beta-Gamma Counts, Efficiency = Alpha Efficiency. This was set this way so that all values could be shown in the same grid view.
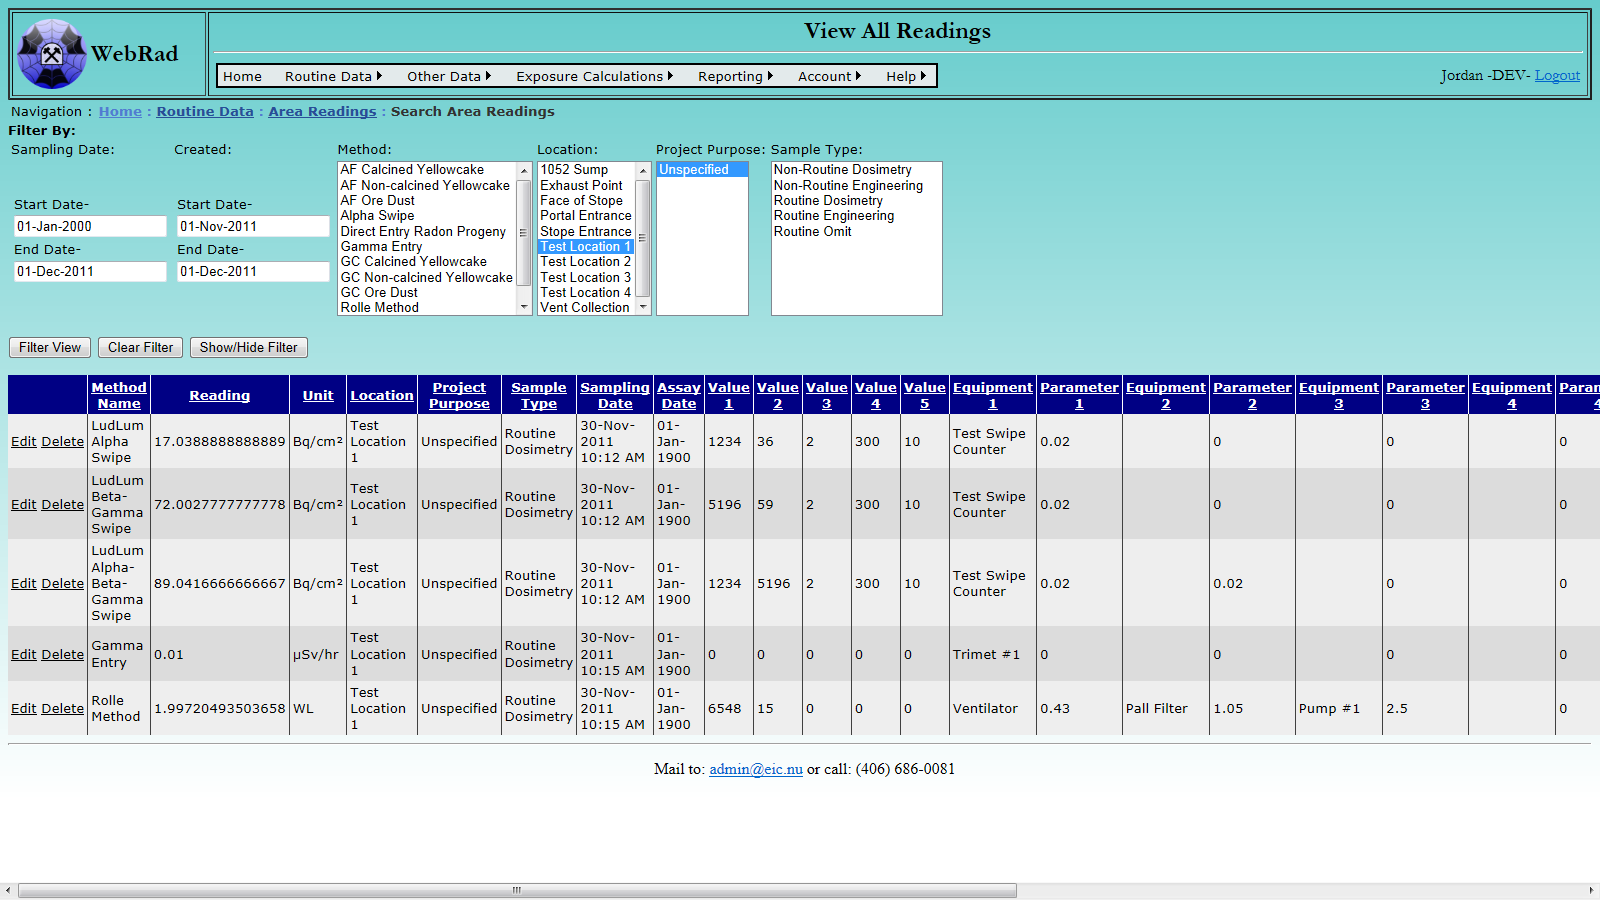
6.4 Searching Area Readings
WebRad also gives the user the ability to look through all possible readings currently in the database. Mouse over "Routine Data" on the menu bar, go down to "Area Readings", go over and click on the "Search Area Readings" link. This page contains the familiar "Filter" view as is found on most of the other pages in WebRad.
To use the filter, first select the appropriate date range for the samples in question. Next, select the Method name corresponding to the way the data was entered. Multiple methods may be selected by holding down the "Crtl" key on the keyboard and selecting multiple methods. Locations, Sample Types, and Project Purposes may be selected in a similar fashion to narrow the search results even more. If no value is selected from the select list, all values are searched for.
Once the appropriate filters are set, click on the "Filter View" button to return the result set. The grid view will be populated with all required values. Multiple columns exist to show what other parameters, constants, values, and equipment were used to make the reading. These are generally filled by reading specific pages like the "Contamination Control Swipes" and "LLRD Gross Counts".
7. Employee Setup
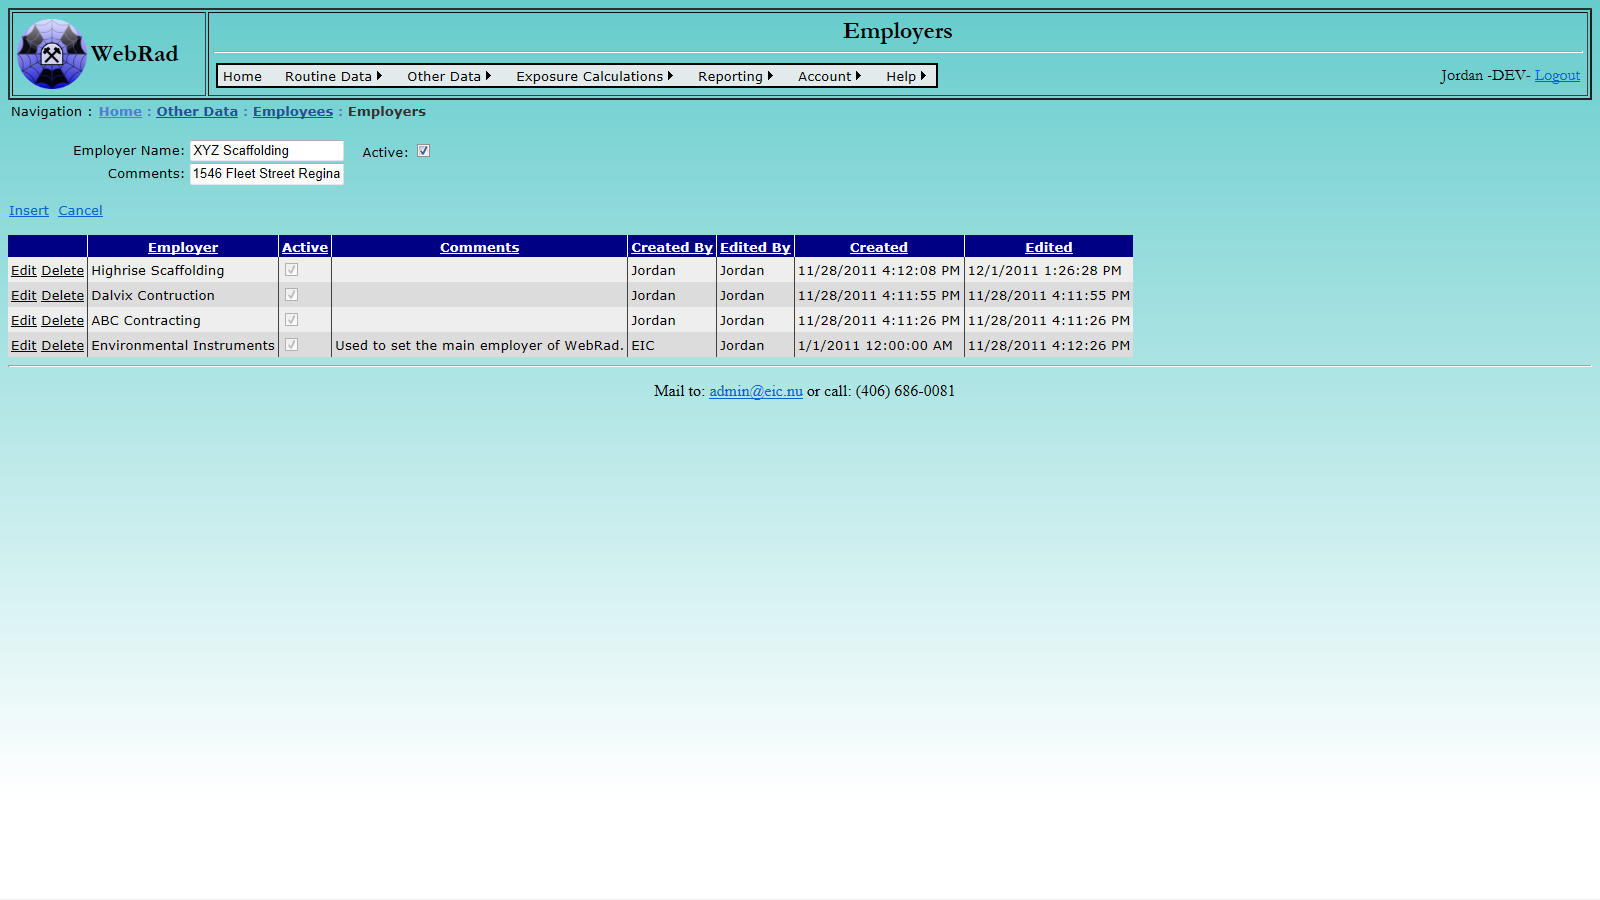
7.1 Entering Employers
Licensees are required to monitor the radiation exposure of not only their own employees, but also of any contractors that are on site. This screen allows you to set up the various employers on your site.
Mouse over "Other Data" on the menu bar, go down to "Employees", go over and click on the "Employers" link. Click on "New Employer". Enter the Employer's name and make sure the "Active" check box is checked. (Only "Active" employers show up in drop-down menus.) Click on "Insert". The new employer now shows up in the grid view.
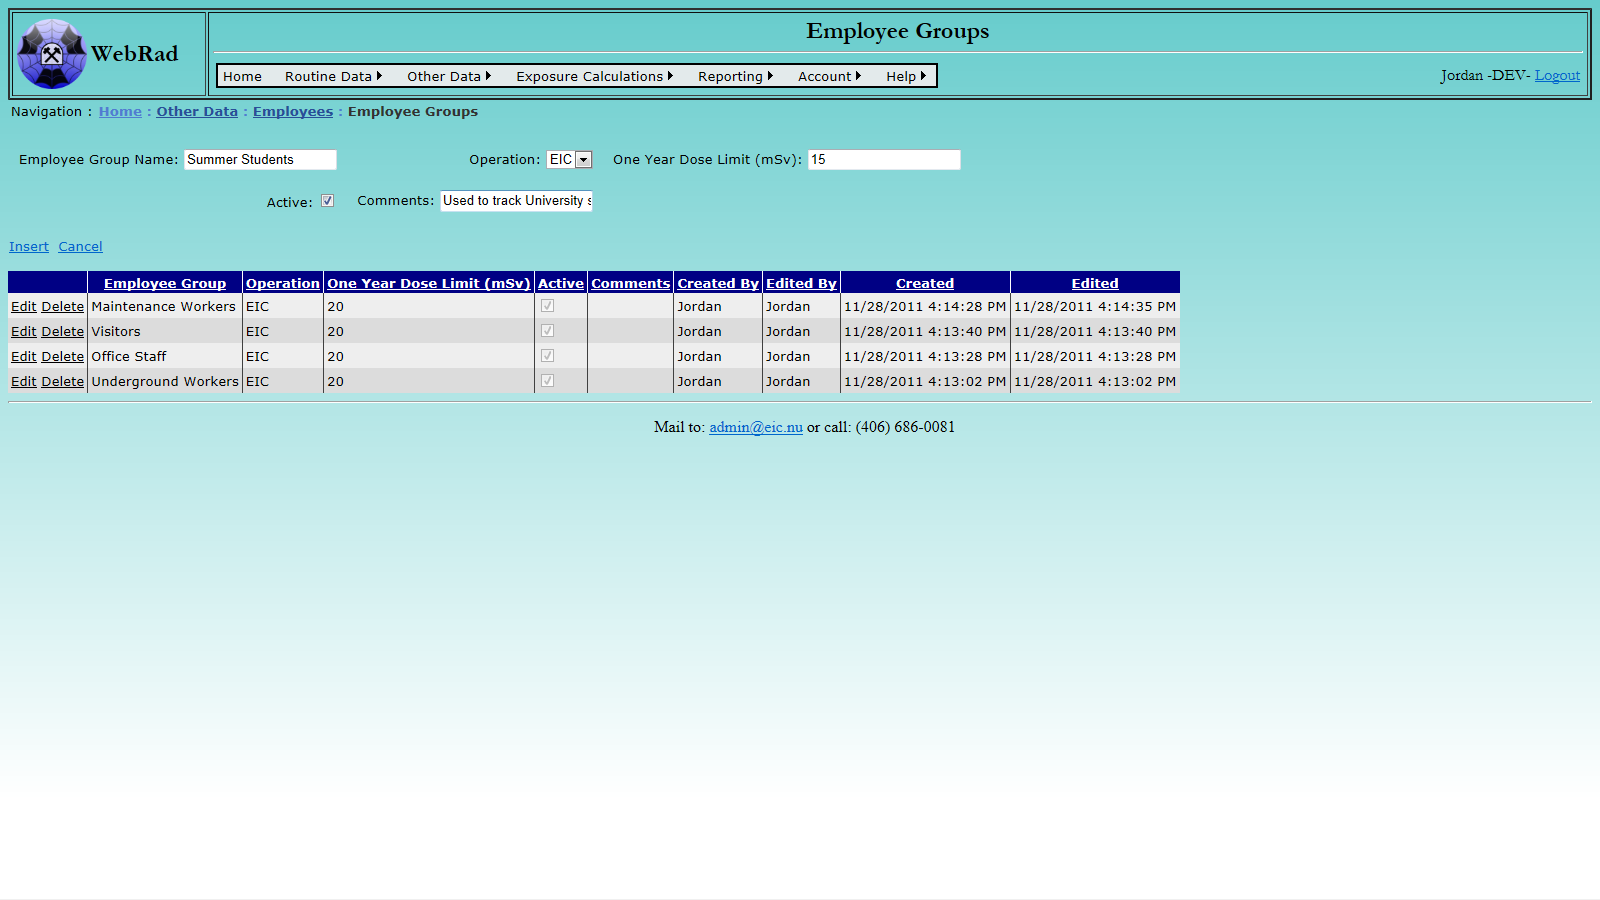
7.2 Entering Employee Groups
Employee Groups are arbitrary groupings that are only used for summarizing exposure results.
Mouse over "Other Data" on the menu bar, go down to "Employees", go over and click on the "Employee Groups" link. Click on "New Employee Group". Select an operation for which you would like to create the employee group. Enter the group's name and the 1 year internal dose limit for your new group. This dose limit will be used to generate personal exposure reports for each of the employee groups. Add any comments and make sure the "Active" check box is checked. (Only "Active" groups show up in drop-down menus.) Click on "Insert". The new group now shows up in the grid view. If no special grouping is required, just set up one group called "All Workers".
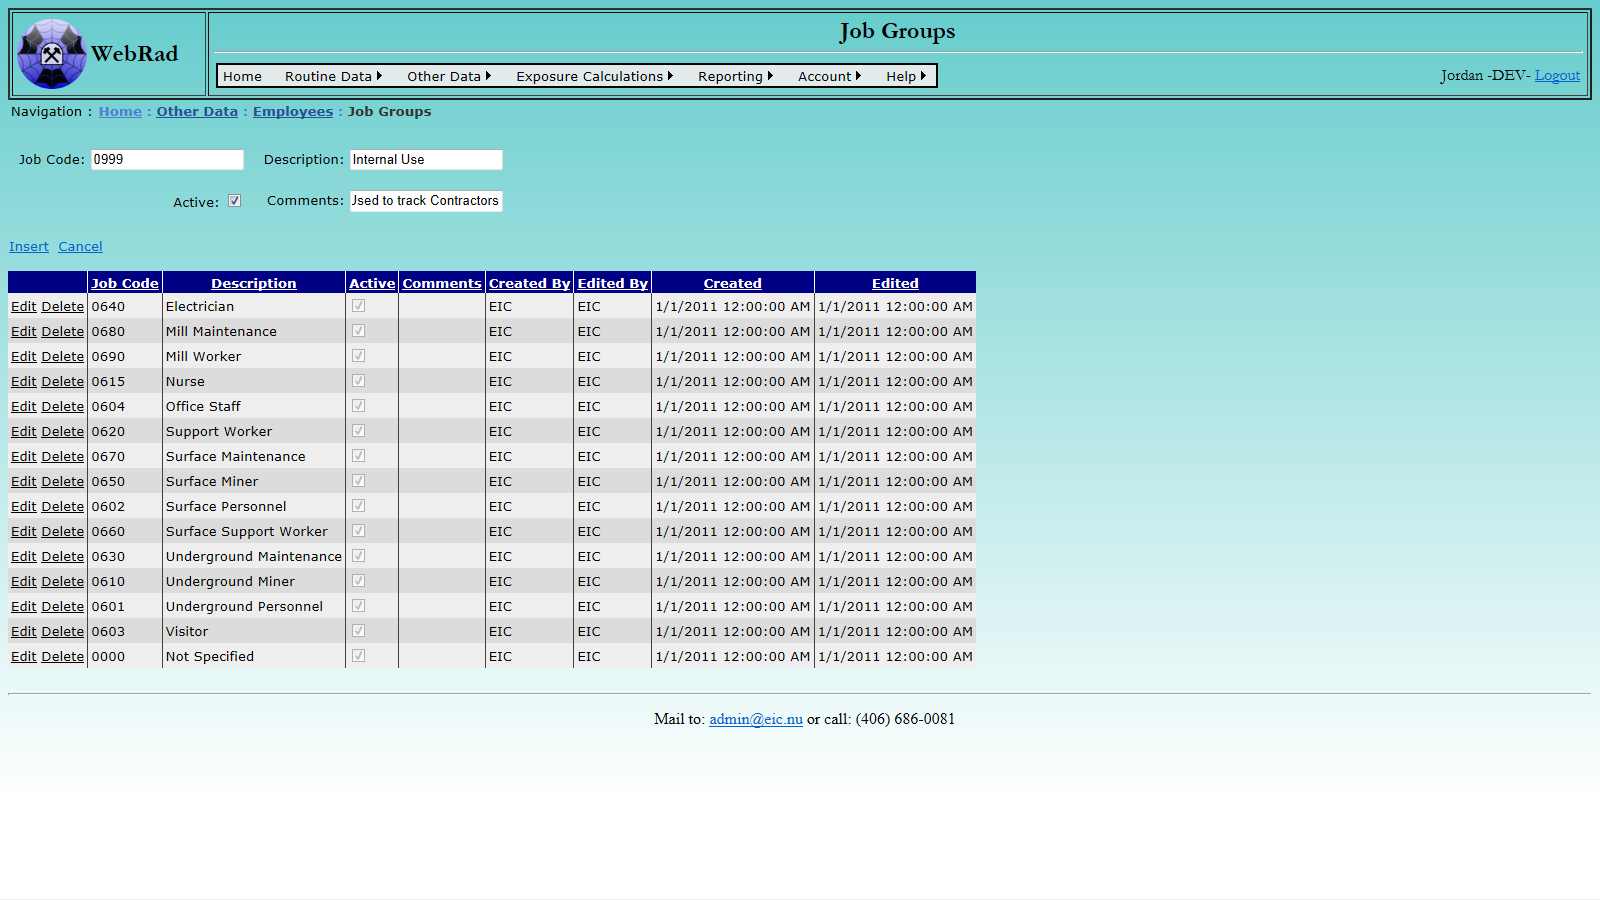
7.3 Job Groups
In addition to employee groups, employees are also assigned job groups. The default job groups in WebRad are the Canadian NDR job groups and their coreponding job codes. If the generation of NDR reports is not required, then these can be deleted or edited to reflect the locally used job groups.
Mouse over "Other Data" on the menu bar, go down to "Employees", go over and click on the "Job Groups" link. Click on the "New Job Group" button. Enter the job code and its description. Make sure the "Active" check box is checked. (Only "Active" job groups show up in drop-down menus.) Click on "Insert". The new job group now shows up in the grid view.
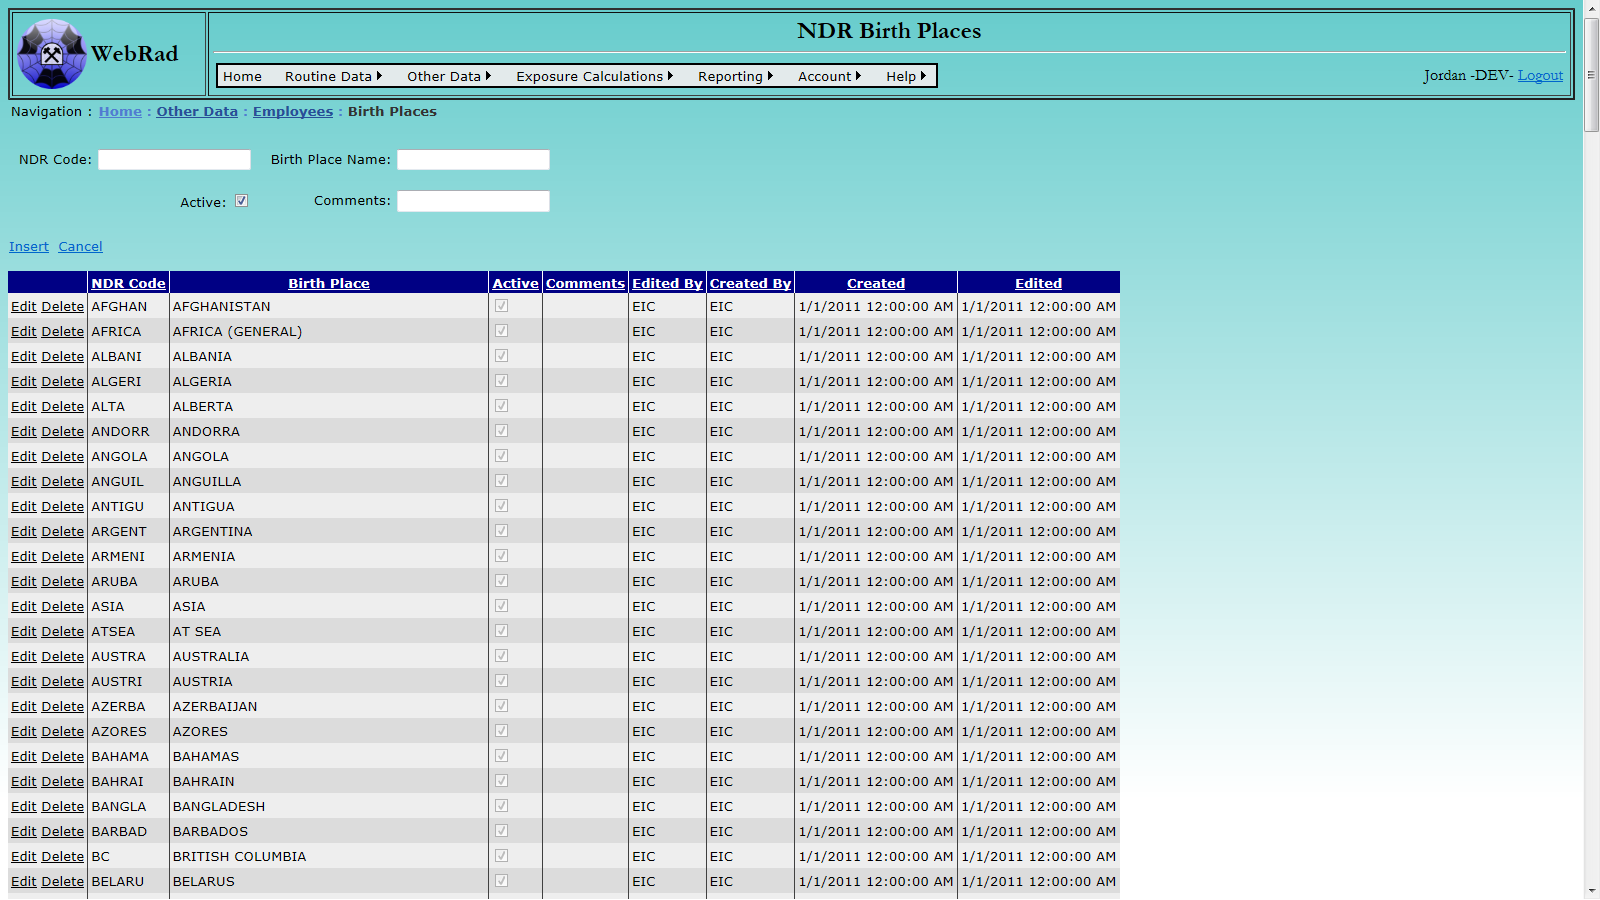
7.4 Birth Places
These are the birth places which can be assigned to employees. By default, WebRad contains the NDR birth places and birth place codes. If the generation of NDR reports is not required, then the birth place codes are irrelevent, and any necessary new birth places can be added.
Mouse over "Other Data" on the menu bar, go down to "Employees", go over and click on the "Birth Places" link. Click on the "New Birth Place" button. Enter the birth place code and birth place name. Make sure the "Active" check box is checked. (Only "Active" birth places show up in drop-down menus.) Click on "Insert". The new birth place now shows up in the grid view.
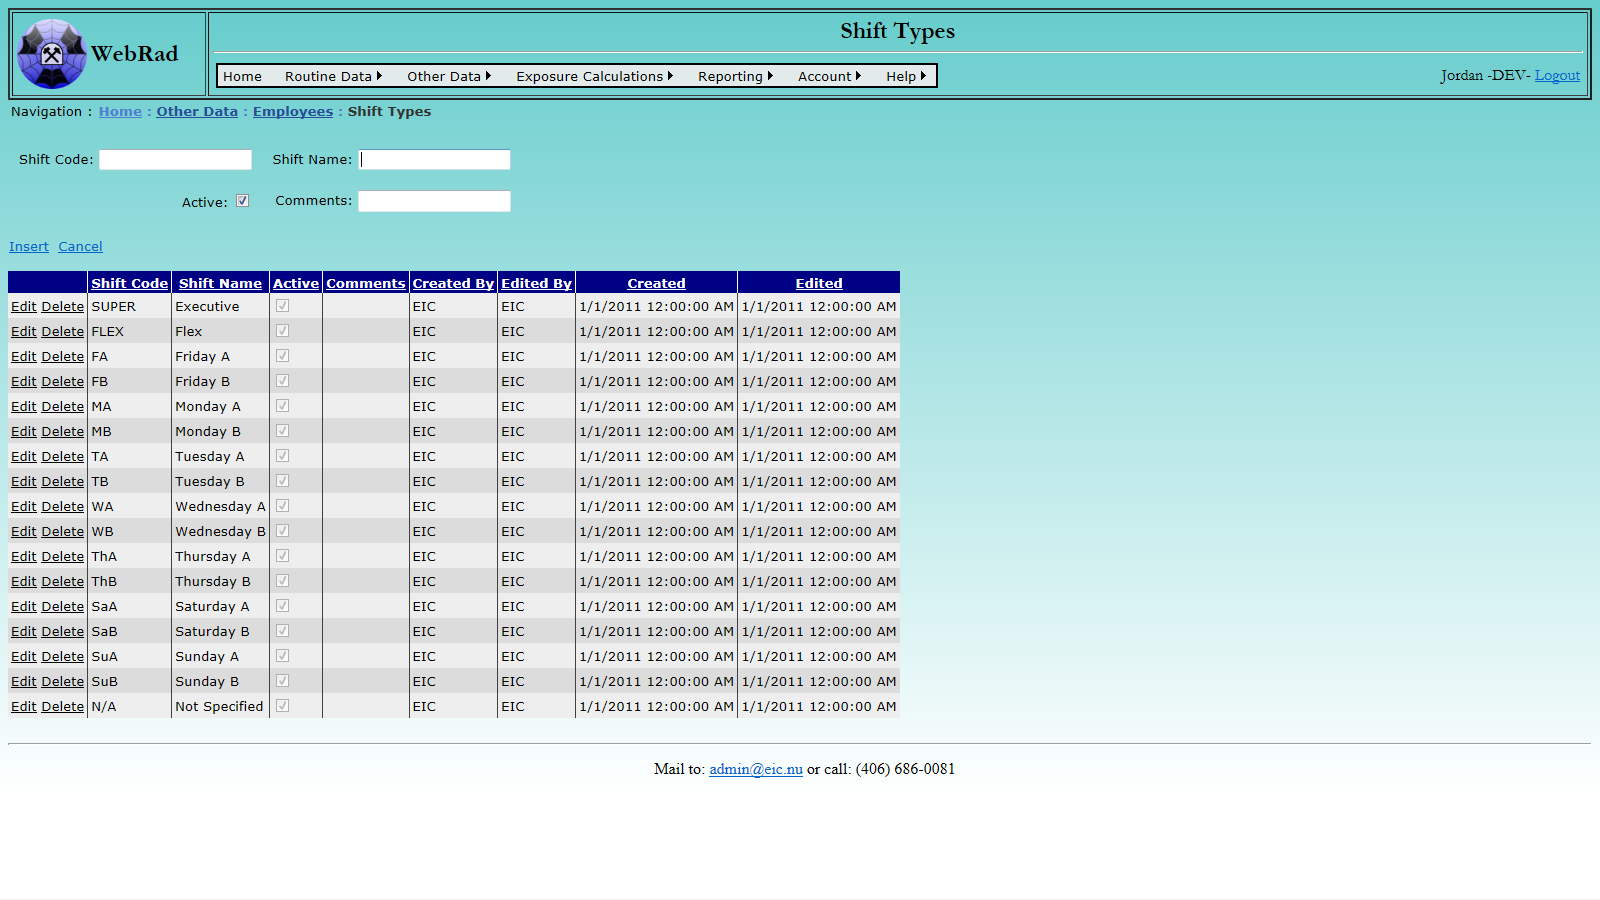
7.5 Shift Types
Shift types can be assigned to employees to designate what shift they work.
Navigate to the Shift Types section. Mouse over "Other Data" on the menu bar, go down to "Employees", go over and click on the "Shift Types" link. Click on the "New Shift Type" button. Enter the shift code and shift name. Make sure the "Active" check box is checked. (Only "Active" shift types show up in drop-down menus.) Click on "Insert". The new shift type now shows up in the grid view.
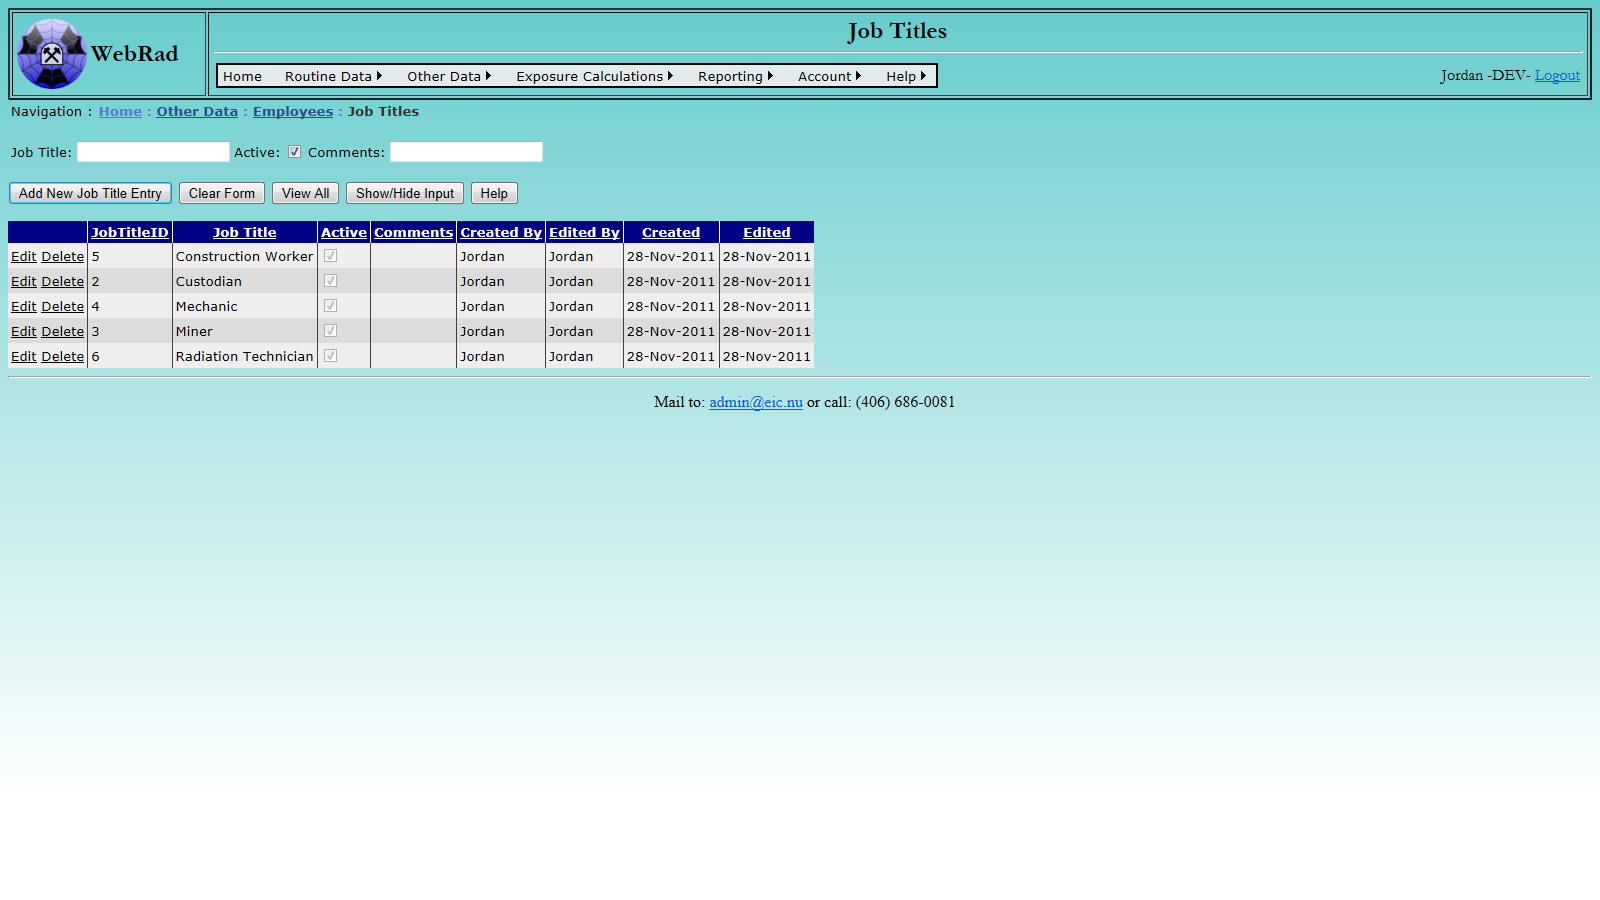
7.9 Job Titles
Job Titles can be assigned to employees to designate the title they have for each Employee History Entry.
Navigate to the Job Titles section , mouse over "Other Data" on the menu bar, go down to "Employees", go over and click on the "Job Titles" link. Enter the information requested. Make sure the "Active" check box is checked. (Only "Active" Job Titles show up in drop-down menus.) Click on "Insert". The new Job Title now shows up in the grid view.
7.7 Entering New Employees
There are two methods available for entering new employees; "Individual Entry" or "Bulk Entry". Both methods can be accessed from the "Employees page". Mouse over "Other Data" on the menu bar, go down to "Employees", go over and click on the "Employees" link. "Bulk Entry" can also be accessed directly from the menu bar ("Other Data" > "Employees" > "Employees Bulk Entry"). These pages will create both an employee record and an associated employee history record. Additional employee history records can be generated by using the employee history page.
Please Note: Both the Employees and the Employees History pages include the Filter Tool for your convenience.
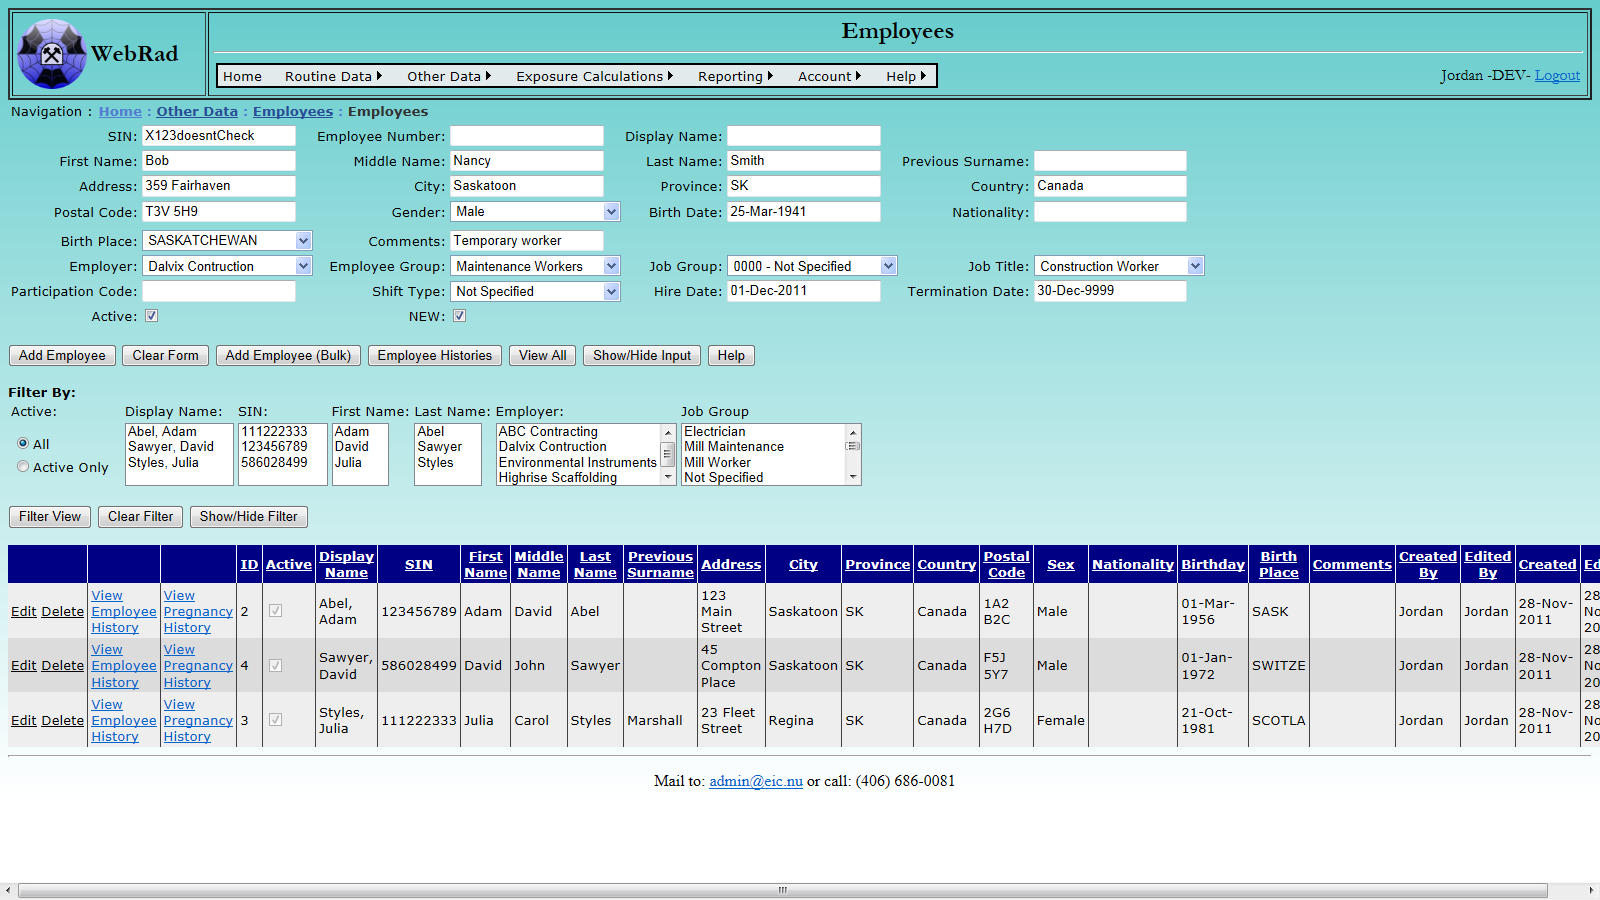
7.7.1 Individual Entry
To access the Individual Entry mouse over "Other Data" on the menu bar, go down to "Employees", go over and click on the "Employees" link. Enter the employee information requested. Once the information is correctly entered – Click "Add".
Please note the following items:
- The SIN (or national equivalent) must be unique.
- In order to override the SIN verification you may start a SIN with a non-numeric character. However this value must still be unique.
- It is not necessary to enter a "Display Name" as long as an employee of the same name as the one you are entering does not already exist. The display name will be generated automatically when the employee is added. If you do enter a display name, then this will override the automatically generated display name. The display name must be unique, therefore, when you try to add the employee, if their display name already exists in the system, then the entry will be rejected and this field will turn red. You will need to manually add a unique display name and then add the employee again.
- Make sure the "Active" check box is checked. (Only "Active" employees show up in drop-down menus.)
WebRad only needs the Display Name and the SIN (or national equivalent) to run. The rest of the demographic information may be required by the dose registry of the host county.
Below the filter view may be used to access employees already in the system. After entering a new employee it may be required to refresh the page so that you can search for them in the combo boxes. Clicking on the "Add Employee (Bulk)" button at the bottom of the input section will take you to the bulk employee entry described in the next section. You can also be directed to create a history for an employee by clicking on the "Employee Histories" button.
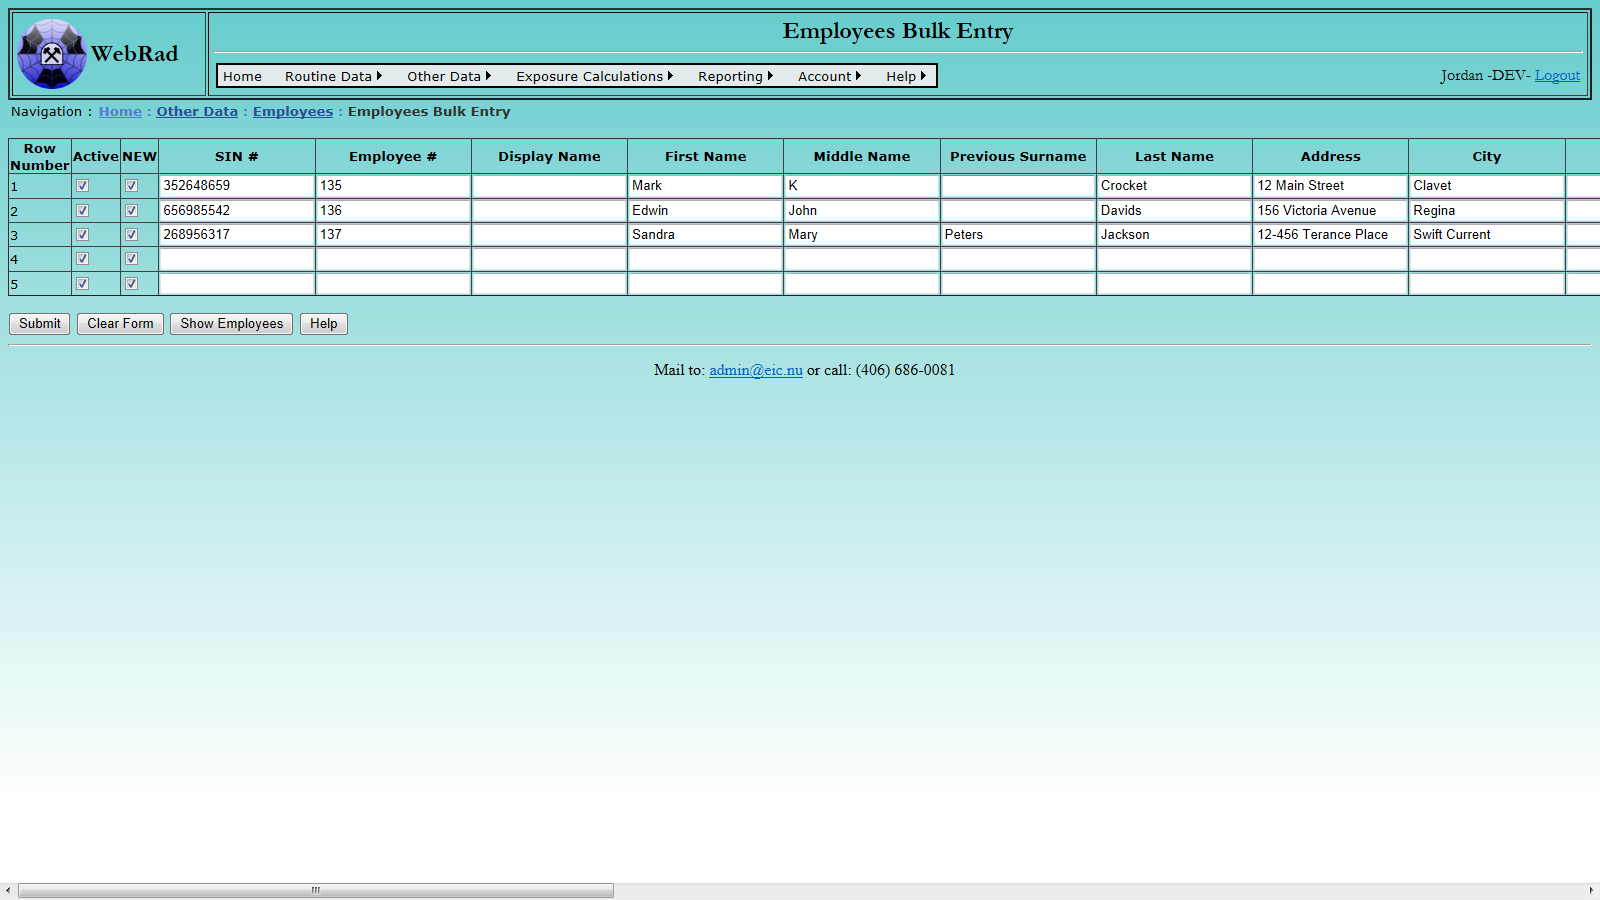
7.7.2 Bulk Entry
To access the Bulk Entry navigate to either: the Add Employees page ("Other Data" > "Employees" > "Employees") and click on the "Add New Employee (Bulk Entry)" button at the bottom, or navigate to "Other Data" on the menu bar, go down to "Employees", go over and click on the "Employee Bulk Entry" link.
Enter the data the same as you would for the Individual Entry, noting the same items, and click "Add".
Please note the following additional items:
- The SIN (or national equivalent) must be unique.
- In order to override the SIN verification you may start a SIN with a non-numeric character. However this value must still be unique.
- If an employee's information is not entered correctly, the employee data will remain in the form. Please correct the improper data and click "Add" again. If the employee data is removed from the form after clicking "Add", then the entry has been properly submitted.
- It is not necessary to enter a "Display Name" as long as an employee of the same name as the one you are entering does not already exist. The display names will be generated automatically when the employees are added. If you do enter a display name, then this will override the automatically generated display name. The display name must be unique, therefore, when you try to submit the form, if a display name already exists in the system, then the entry will be rejected and this line will remain on the form and the display name field will turn red. You will need to manually add unique display names and then submit the form again.
The Bulk Entry can be viewed with or without the Employee Display for your convenience. To switch your view use the "Show Employees" button. Please Note: Switching between showing and not showing employees will cause any data already entered into the form to be lost!
7.8 Entering Employee History Data
Employee histories are used to keep track of employee data which changes when an employee is terminated and rehired, or changes positions within the company. Multiple entries can be made for a single employee. Note that the termination date for an employee's current history entry should be set sometime in the future (30-Dec-9999 by default), once they are terminated this can be edited to reflect their actual termination date.
Employee histories can be accessed from the "Employees" page by searching the grid view for individual employees or histories can be modified in a bulk fashion from the "Employee History" page. Both methods are described below.
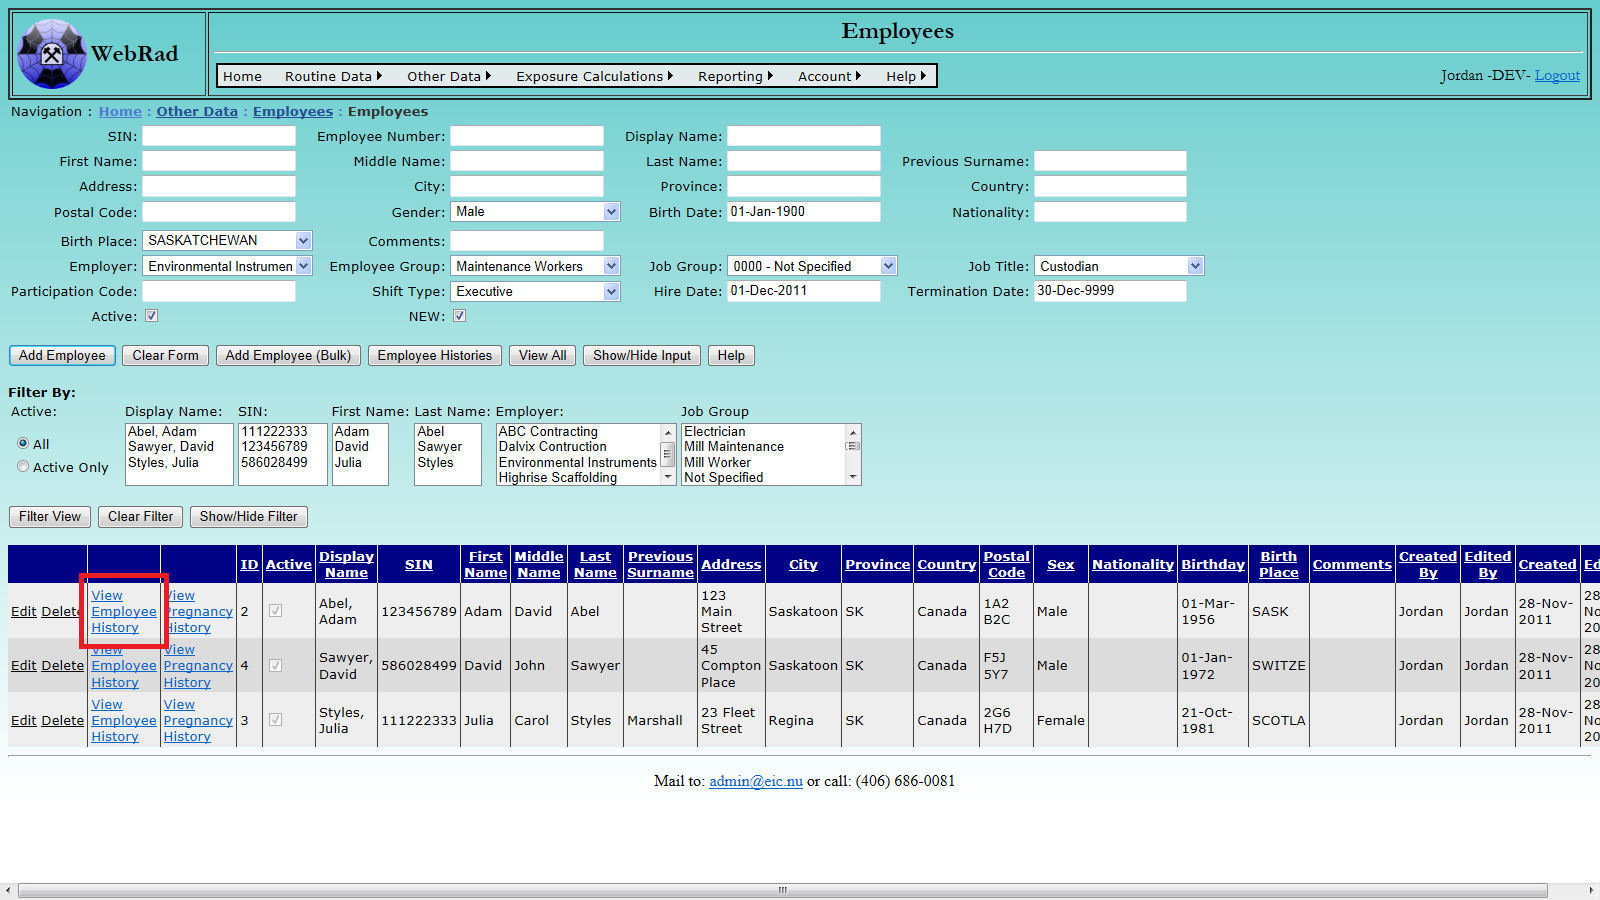
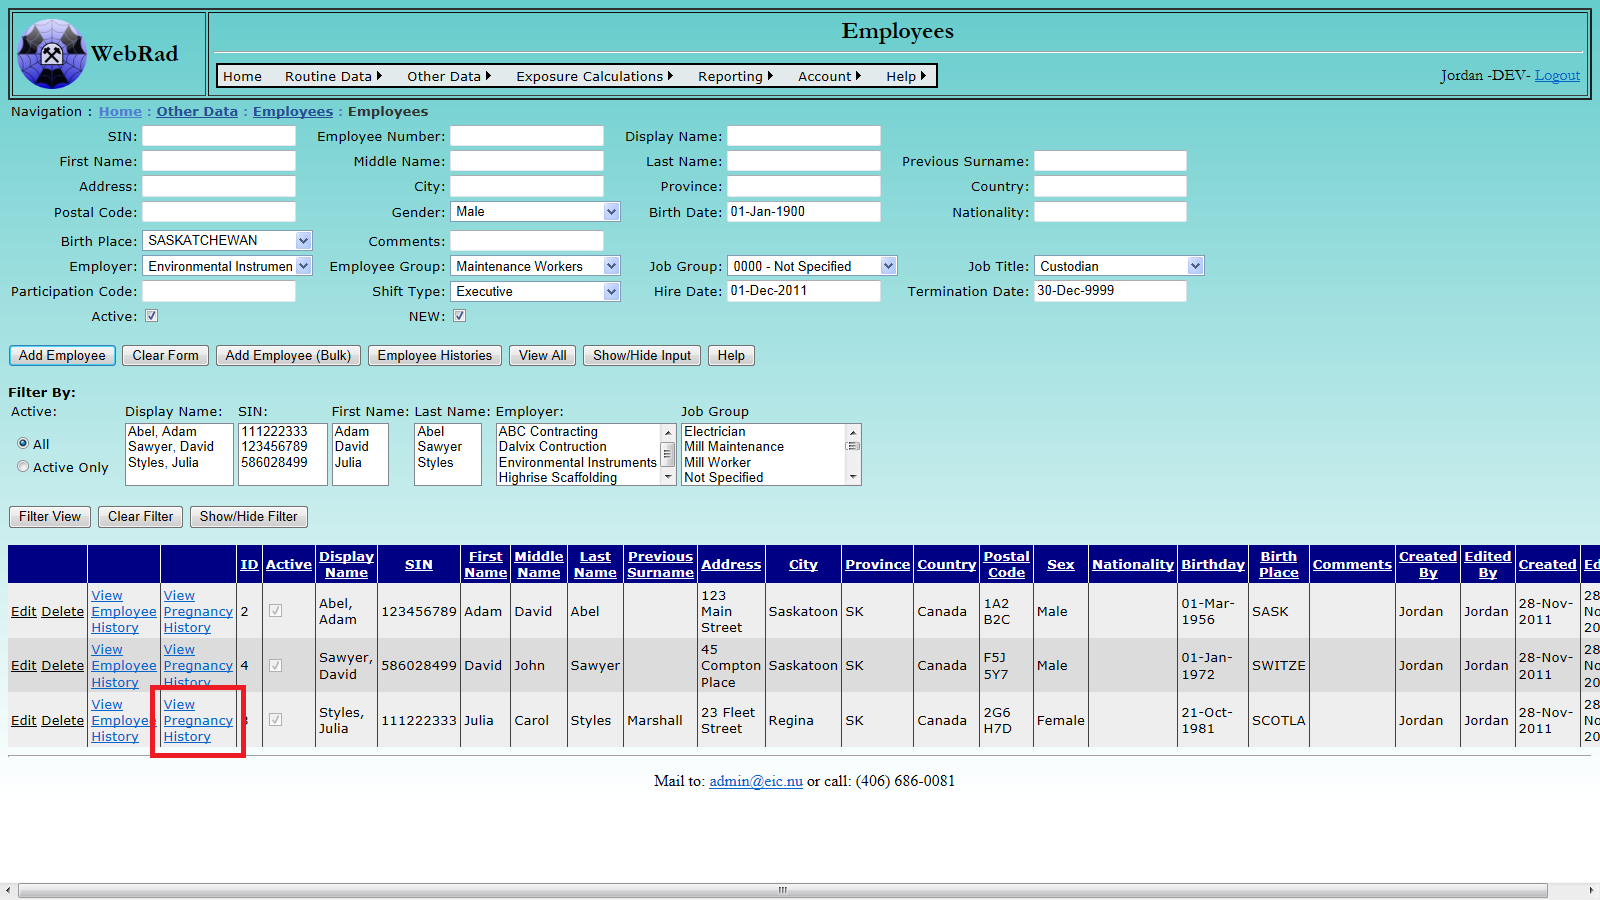
7.8.1 From Employees Page
Mouse over "Other Data" on the menu bar, go down to "Employees", go over and click on the "Employee" link. Using the filter options at the bottom of the page find the employee whose history you want to modify. Click "Filter View" to show the filtered employee records. In the column to the left of employee you are searching for, click on the link "View Employee History". This will cause a pop-up window to appear displaying all available histories for that employee. From this screen you may modify existing histories or create new ones.
Fill in all required areas and give the history a hire and termination date. If the termination date is unknown leave it at the default value (30-Dec-9999). The termination date can later be modified when that employee history is closed out. Upon a successful entry, the employee's current entry will automatically be changed to the one which was just created. Similarily, employee records may be edited from the grid view below using the "Edit" button.
Upon a successful entry of a new record, the employee's current entry will automatically be changed to the one which was just created.
Please Note: If a menu bar appears at the top of the page and blocks the pop-up window, click it and select "Always allow pop-ups from this website".
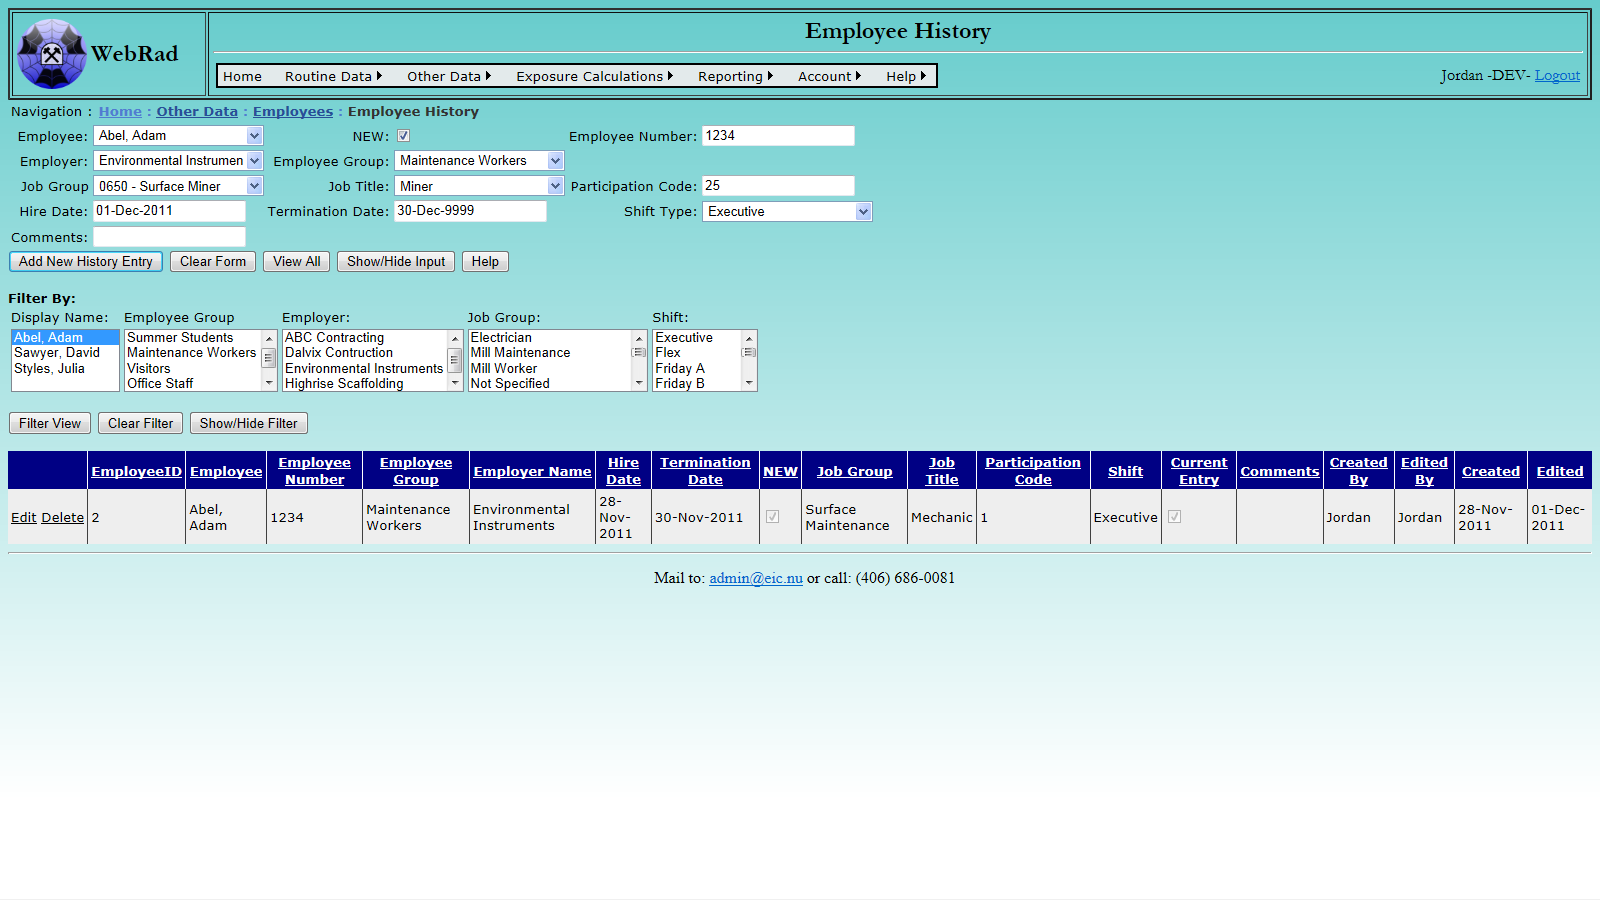
7.8.2 Employee History Page
Mouse over "Other Data" on the menu bar, go down to "Employees", go over and click on the "Employee History" link (This page can also be accessed from the "Employees" page by clicking on the "Employee histories" button below the data entry section). Select the employee for which you wish to create a new history. At the same time it is a good idea to use the filter view below to filter for that employee and see what histories currently exist for them. If adding a new history make sure to edit the old histories and set the appropriate termination dates (30-Dec-9999 by default). Enter the employee history information which is requested. Once the information is correctly entered click "Add New History Entry".
Upon a successful entry of a new record, the employee's current entry will automatically be changed to the one which was just created.
7.9 Entering New Pregnancy History Data
Pregnancy history is used to keep track of employee data which changes when an employee becomes pregnant while employed by a company. It allows a way to track pregnancy notification dates, estimated start dates, and actual maternity leave dates. Multiple entries can be made for a single employee.
7.9.1 From Employees Page
Mouse over "Other Data" on the menu bar, go down to "Employees", go over and click on the "Employee" link. Using the filter view at the bottom of the page, find the employee for which you wish to edit/add the pregnancy history. In the grid view Click on the "View Pregnancy History" link next to the employees name. In the screen that pops up, you may use the filter view to look through previous pregnancy histories and edit them or you may add a new one. If adding a new history, fill in the required dates along with any comments. Once the information is correctly entered – Click "Add New History Entry".
Please Note: If a menu bar appears at the top of the page and blocks the pop-up window, click it and select "Always allow pop-ups from this website".
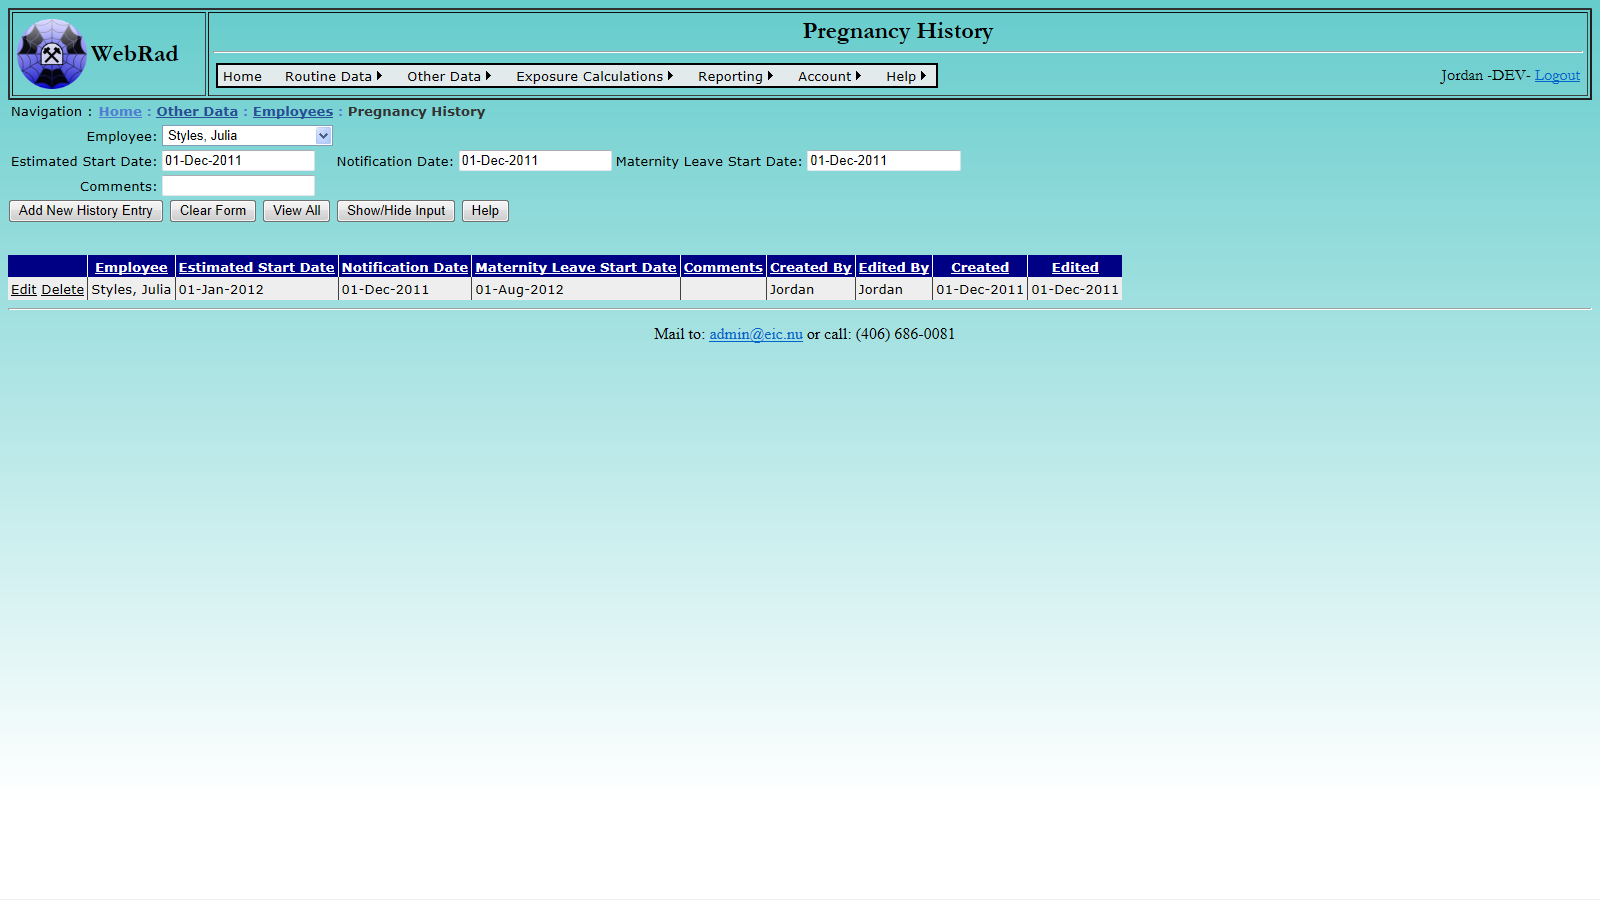
7.9.2 From Pregnancy History Page
Navigate to the Pregnancy History Section, mouse over "Other Data" on the menu bar, go down to "Employees", go over and click on the "Pregnancy History" link. Choose an employee from the list and enter the requested information. Once the information is correctly entered – Click "Add New History Entry".
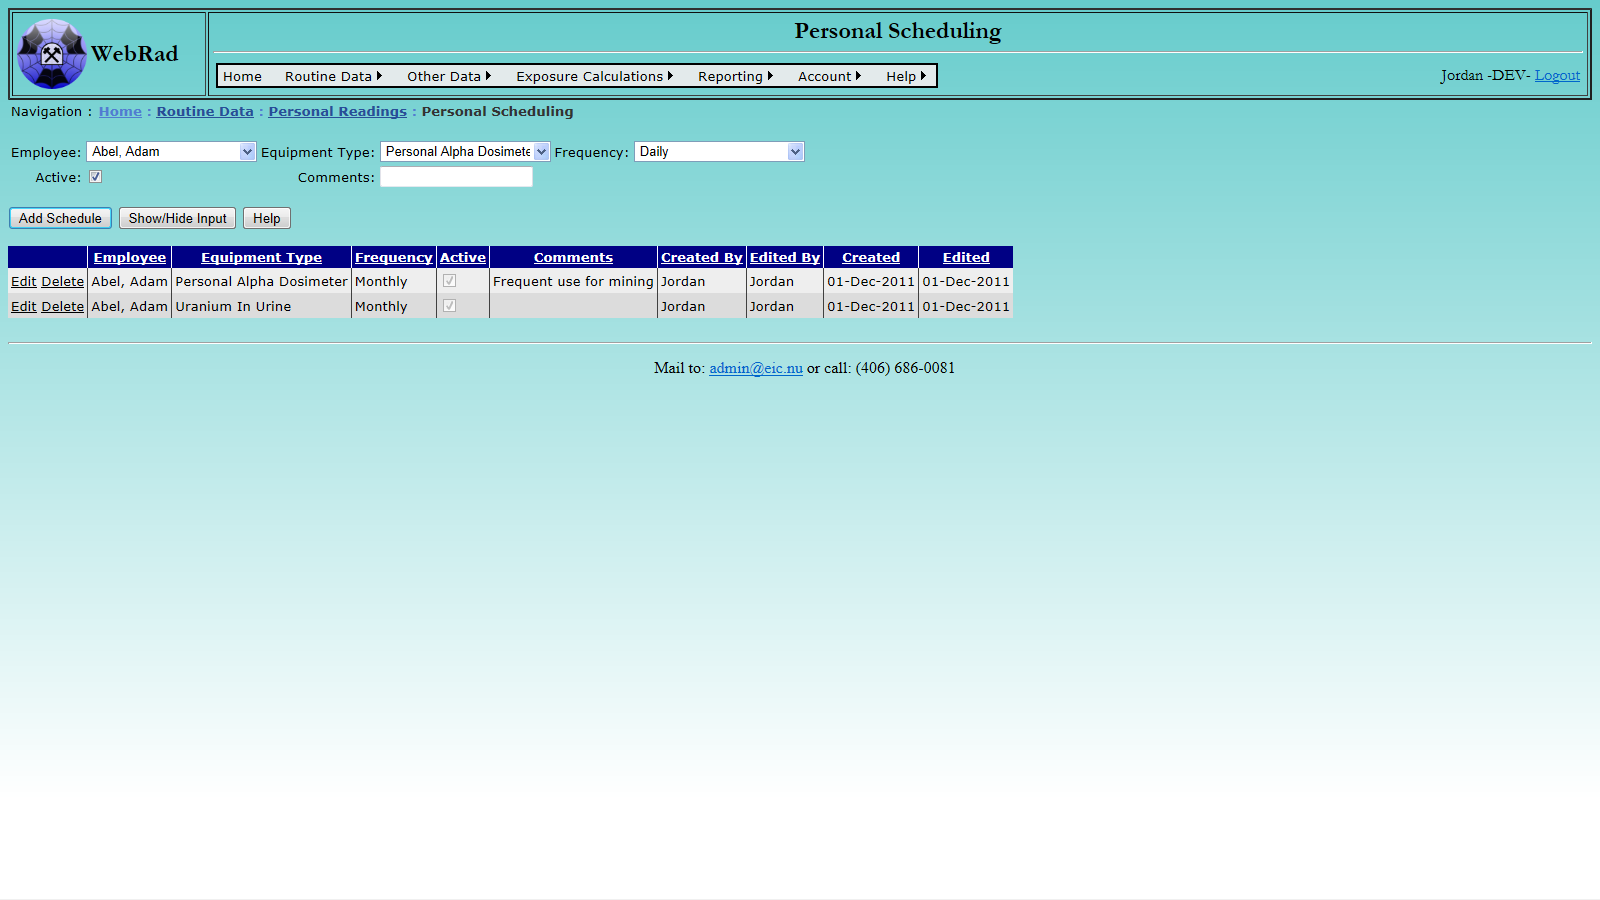
7.10 Personal Scheduling
The Personal Scheduling page is used to keep track of what frequencies certain employees are on for their Personal Readings. A employee may have several scheduling frequencies, any number of which may be set to active.
Mouse over "Routine Data" on the menu bar, go down to "Personal Readings", go over and click on the "Personal Scheduling" link. From this page, select an employee from the drop down box. The grid view below will populate with all schedule frequencies ever created for that employee. To enter a new frequency, select the "Equipment Type" for the frequency you wish to create. Next, select the "Frequency" of use. Type in any comments if required, make sure the "Active" check box is set to the appropriate status, then click on the "Add Schedule" button to insert the record. The grid view will refresh with you new schedule created.
8. Time Card Setup
8.1 Entering Exposure Calculation Schemes
Time card records are entered so that personal exposures can be calculated. First, we have to tell WebRad the rules for calculating exposures. By default, WebRad is set up to handle two different calculation "Schemes": Area Monitoring and Task Monitoring. When Area Monitoring is used, the underlying assumption is that people working in the same area are exposed to the same contaminant concentration. For Task Monitoring, the underlying assumption is that people performing the same task are exposed to the same contaminant concentration.
One calculation scheme can be used for several contaminants. For example, radon progeny, thoron progeny and radon gas exposures might all be calculated with the default Area Monitoring scheme.
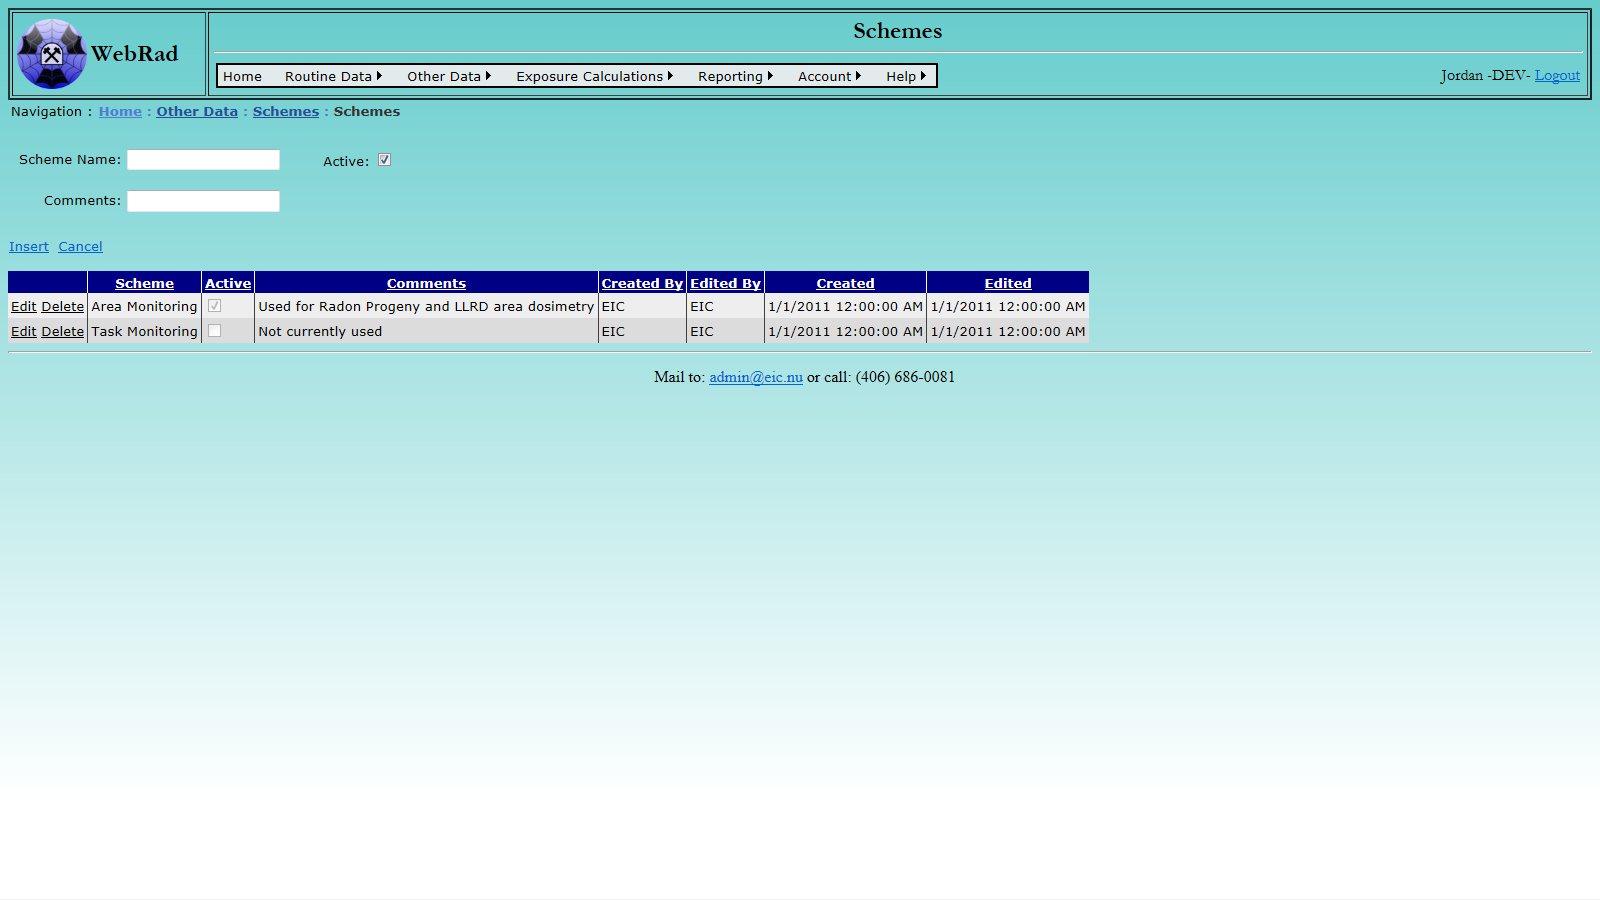
To add a new Scheme, mouse over "Other Data" on the menu bar, go down to "Schemes", go over and click on the "Schemes" link. Click on "New Scheme". Enter the scheme name and description. Make sure the "Active" check box is checked. (Only "Active" schemes show up in drop-down menus.) Click "Insert".
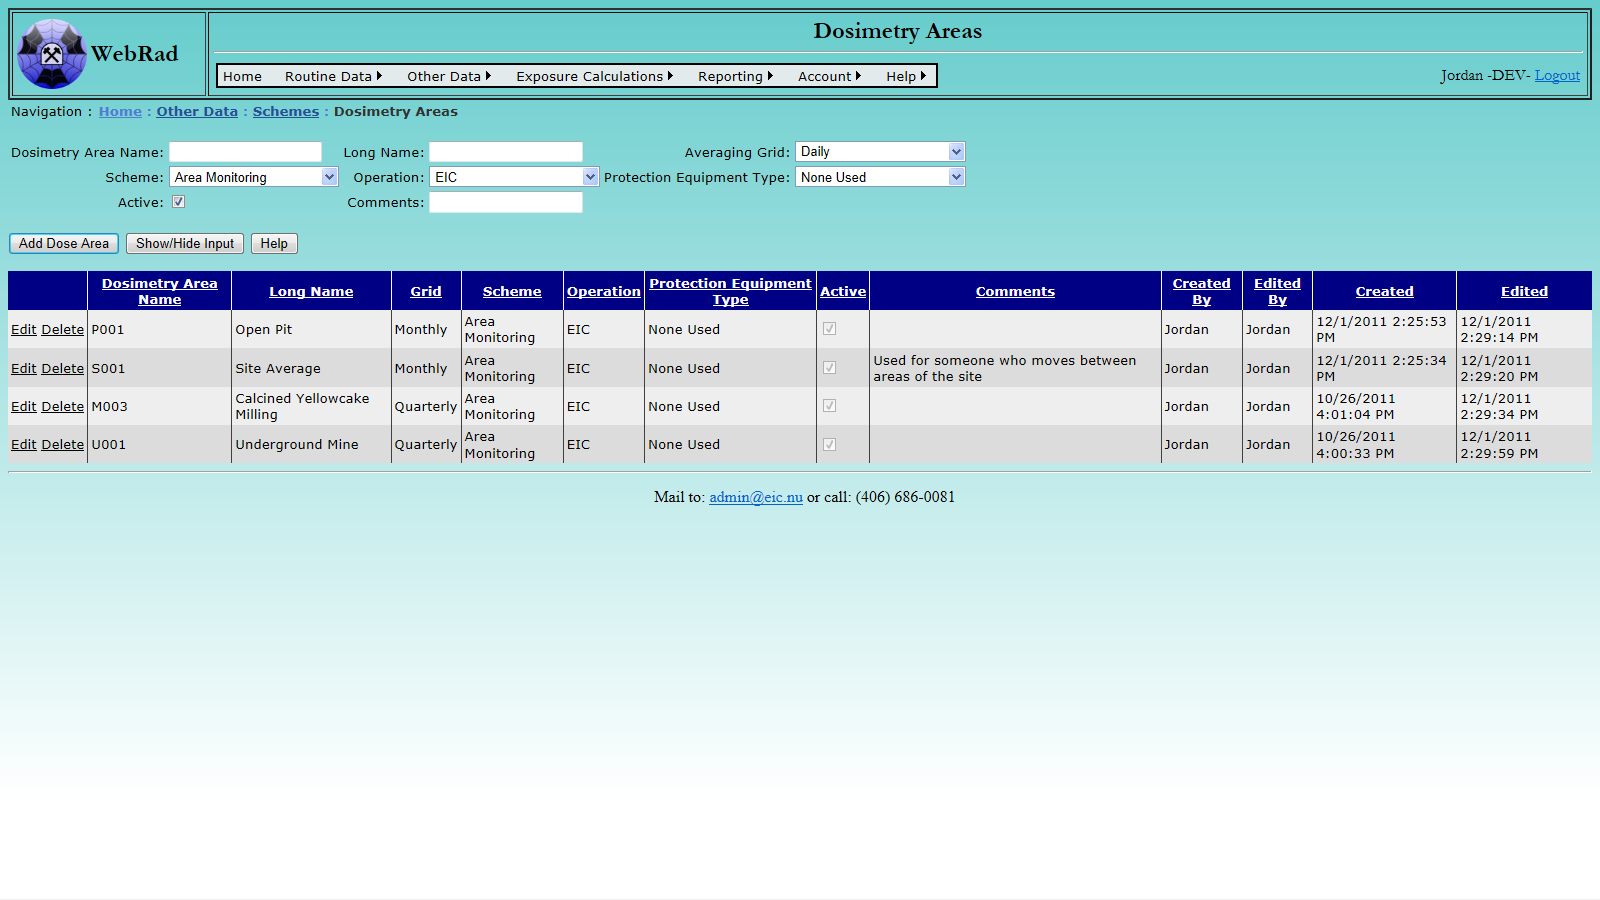
8.2 Entering Dosimetry Areas
Workers log their time against "Dosimetry Areas". The amount of time spent in a Dosimetry Area is multiplied by the average contaminant concentration to arrive at an exposure value. The "Dosimetry Areas" should not be confused with "Sampling Areas". Both Dosimetry Areas and Sampling Areas contain "Locations". However, there are significant differences:
One "Location" is only a member of one "Sampling Area". That means "Sampling Areas" are mutually exclusive. However, that same "Location" can be a part of several "Dosimetry Areas". For example, the Location "Bottom of Ramp" is in the "Sampling Area" "Pit Area". A loader operator would log his time in the "Dosimetry Area" "Pit", while a radiation technician would log his time as "Site Average". Both of these Dosimetry Areas would contain the "Bottom of Ramp" Location.
To add a new Dosimetry Area, mouse over "Other Data" on the menu bar, go down to "Schemes", go over and click on the "Dosimetry Areas" link. Type the name of the Dosimetry Area and select "Operation" and "Scheme" which that area corresponds to. Protection equipment can be assigned to that dosimetry area so that when time cards are logged to that area they will automatically be assigned a respirator. Finally select the time grid corresponding to that area:
- Daily means that all readings in a day for locations that are members of this Dosimety Area are averaged. If there are no readings that day, WebRad looks at the previous day. This is continued until a value is found or for 30 days. If no value is found looking back 30 days, the value is set to zero and it is flagged as a calculated null during exposure calculations.
- Weekly means that all readings for a given week for locations that are members of this Dosimety Area are averaged. Weeks start on Sunday and end on Saturday as per the SQL standard. If there are no readings that week, WebRad looks at the previous week. This is continued until a value is found or for 3 weeks. If no value is found looking back 3 weeks, the value is set to zero and it is flagged as a calculated null during exposure calculations.
- Monthly means that all readings for that month for locations that are members of this Dosimety Area are averaged. If there are no readings that month, WebRad looks at the previous month. This is continued until a value is found or for 3 months. If no value is found looking back 3 months, the value is set to zero and it is flagged as a calculated null during exposure calculations.
- Quarterly means that all readings for that quarter for locations that are members of this Dosimety Area are averaged. If there are no readings that quarter, WebRad looks at the previous quarter. If no value is found for the previous quarter, the value is set to zero and it is flagged as a calculated null during exposure calculations.
- Yearly means that all readings for that year for locations that are members of this Dosimety Area are averaged. If there are no readings that year, the value is set to zero and it is flagged as a calculated null during exposure calculations.
Note: The look back frequency can be modified on a database level if it ever needs to be changed but is set up by default as stated.
Where contaminant concentrations are potentially high and where there are large swings in values over time, as is sometimes the case for radon progeny in underground uranium mines, the daily grid should be used. In that case, the workers' time is matched to the contaminant concentration on a daily basis.
For contaminants where the concentration is not expected to be very time dependent, larger grid values are used. Long-Lived Radioactive Dust exposures are sometimes assigned based on the average readings during the quarter. Using a larger time grid reduces the effect of unrepresentative samples and measurement error.
Usually, only one time grid is used for any scheme. However, WebRad can handle different time grids used with the same scheme. For example, you could have a monthly radon progeny area monitoring program for a uranium mill, but a daily one for the underground mine.
Select the appropriate calculation Scheme, make sure the "Active" check box is checked and hit "Add Dose Area".
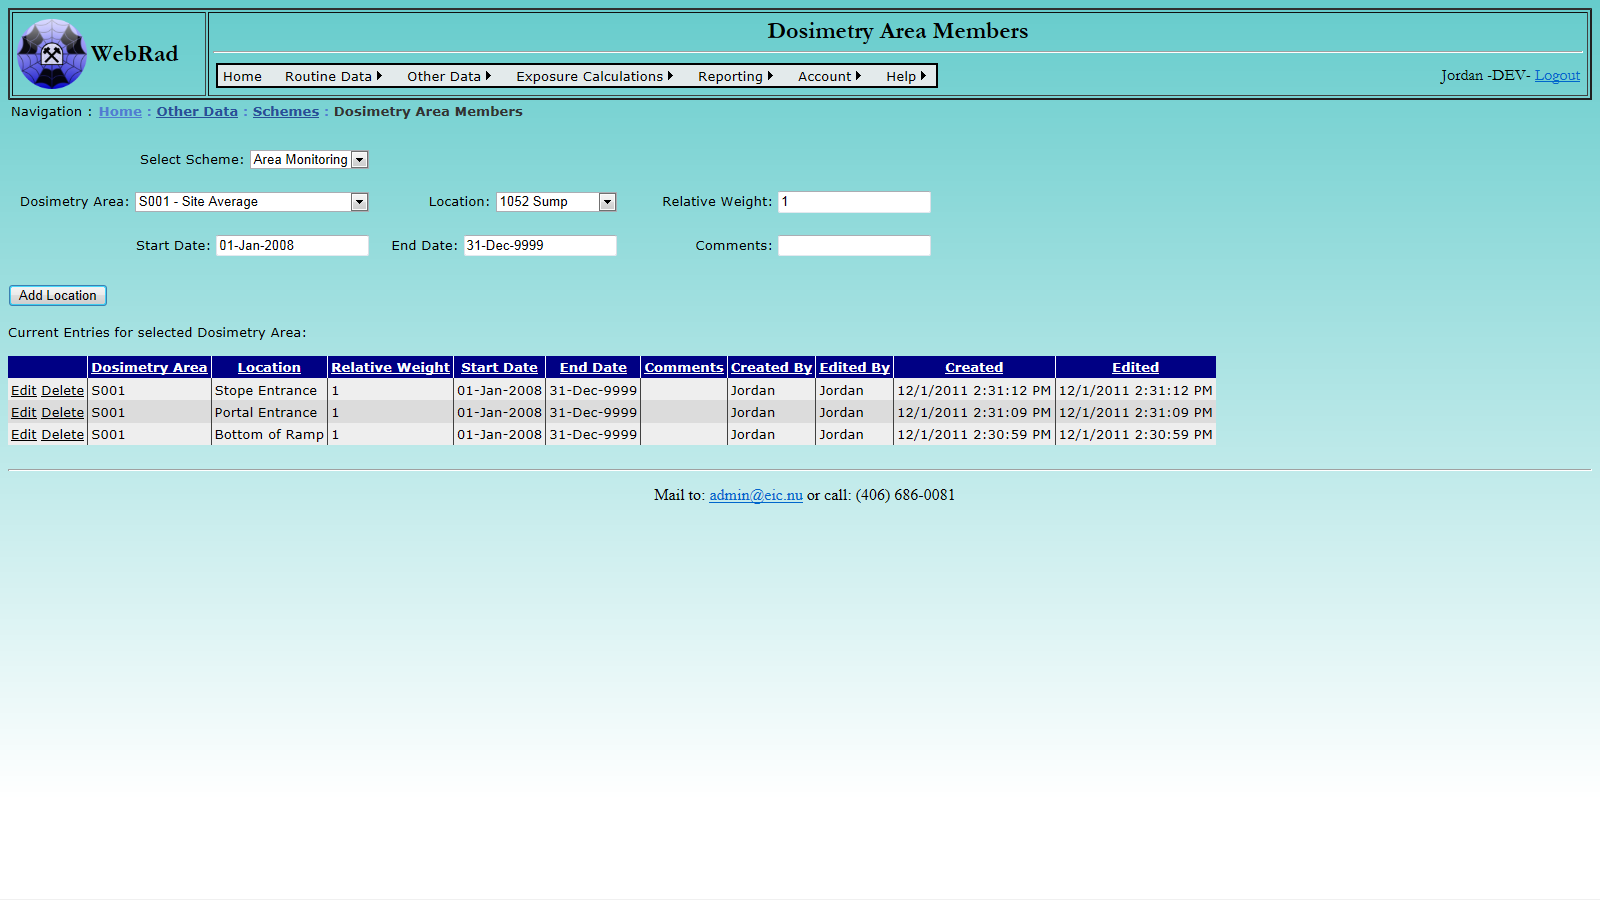
8.3 Selecting Dosimetry Area Member Locations
To tell WebRad which locations are members of a particular Dosimetry Area, mouse over "Other Data" on the menu bar, go down to "Schemes", go over and click on the "Dosimetry Area Members" link. Select the Scheme for which you are entering data. For example, if you are entering Dosimetry Areas for radon progeny area monitoring, select "Area Monitoring". Select the Dosimetry Area from the dropdown box and select one of the locations that is part of the Dosimetry Area. Select the relative weight that location has in the average. If you leave the default of 1, all readings contribute equally to the average. If you have a Dosimetry Area, consisting of two Locations, where workers spend 90% of their time in one location and only 10% of the time in the other, then you should give the first location a relative weight of 9. (An example of this situation might be a heading in an underground mine, where workers spend most of their time at the face, but some time in the access.)
Select the date that the Location became a member of the dosimetry area and a date when it stopped being a member of the dosimetry area. Usually, you would pick a date far in the future for the end date and edit the record, once the Location is no longer a member of the Dosimetry Area.
Click on "Add Location". The form will reload with the same information that you just saved. Continue adding locations as Dosimetry Area members until all required locations are associated to the Dosimetry Area.
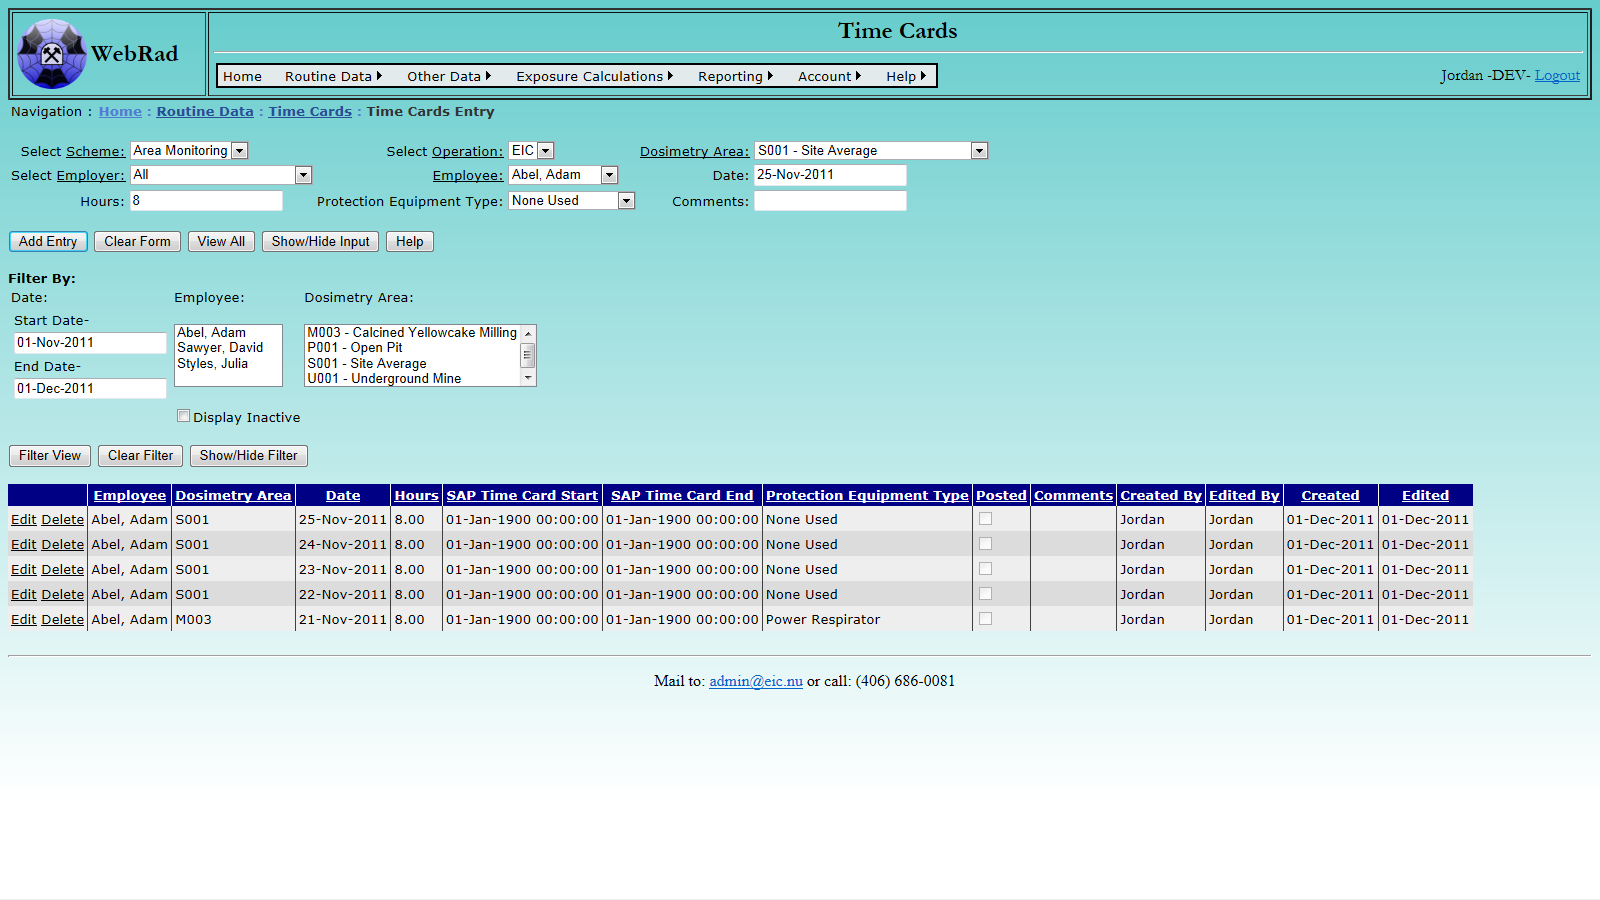
8.4 Timecards
8.4.1 Entering Timecards
Mouse over "Routine Data" on the menu bar, go down to "Time Cards", go over and click on the "Time Cards" link. First select the operation for which you are entering the time card. This will filter the dosimetry areas to show only the ones for that operation. Select the scheme for which you are entering data. For example, if you are entering time cards for radon progeny area monitoring, select "Area Monitoring". Select one of the available dosimetry areas from the dropdown box. Next, select the employee from the drop down list. This list can be filtered first by choosing an appropriate employer, or leaving the employer at the default setting of "All".
Select the date the employee was in the area and enter the hours spent. You may also choose to assign a piece of protection equipment if they were wearing any. If a protection factor exists for that piece of equipment on the date of the time card, then any dose estimates made from that time card will automatically be added to exposure calculations for that day. This is under the assumption that a worker would take off their dosimeter if they have a piece of protection equipment that protects them from the same contaminant as the dosimeter.
Once all information is reviewed, click the "Add Entry" button. If no errors are shown, this will cause the time card to be loaded into the database and the grid view to be refreshed.
8.4.2 Time Cards Import
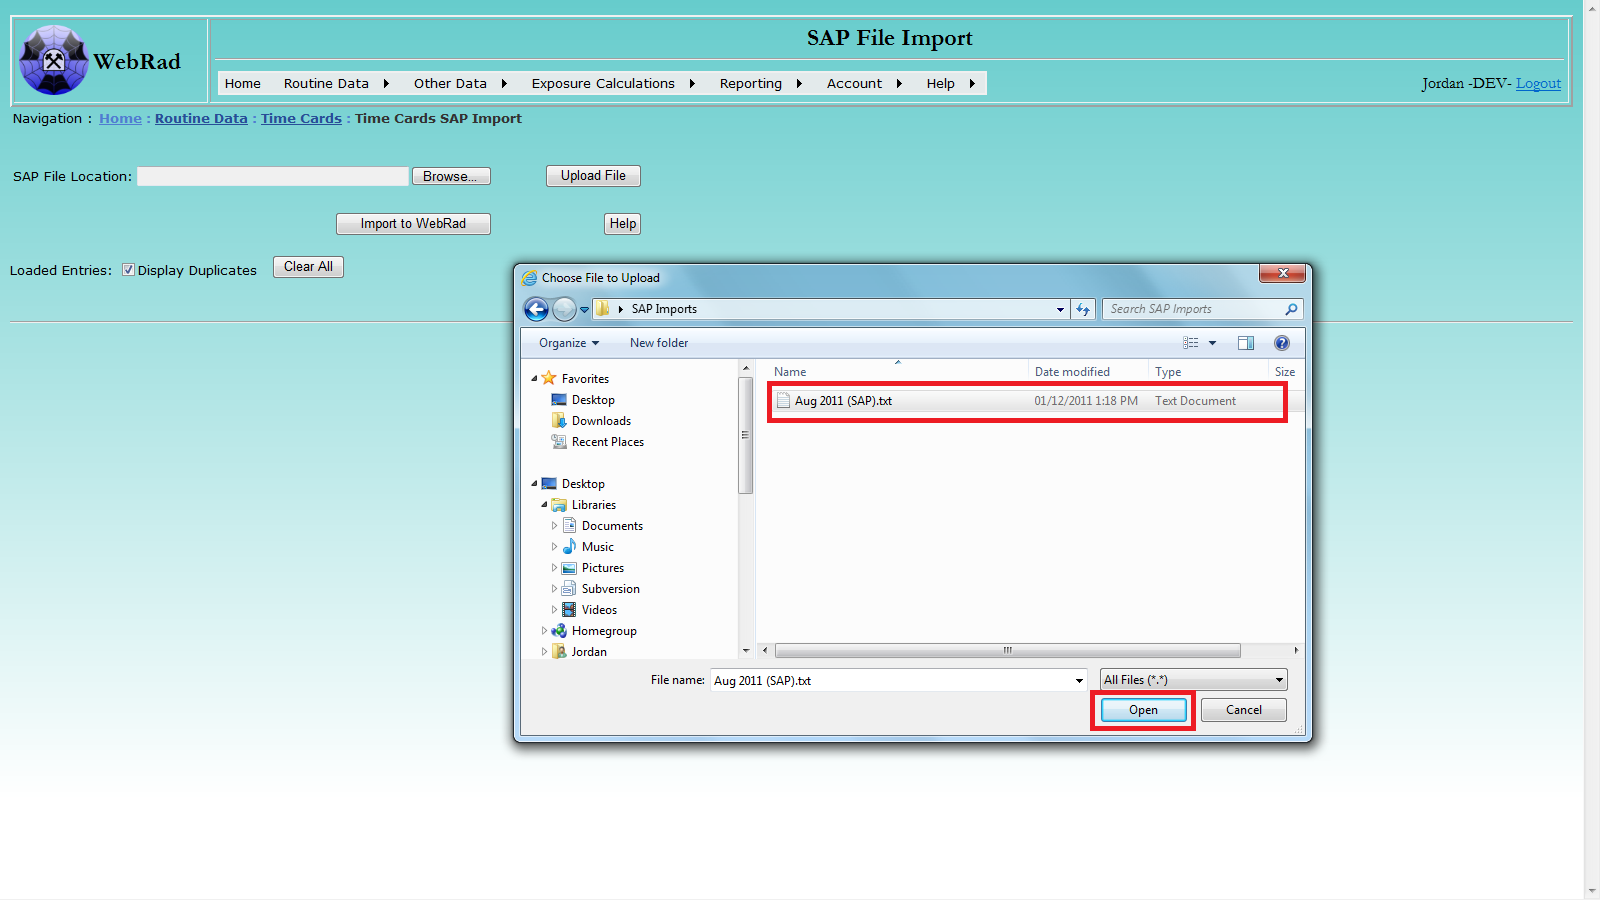
To import time cards from a SAP file, follow three convenient steps: browse and locate the SAP file from your disk, upload it, and import the loaded records.
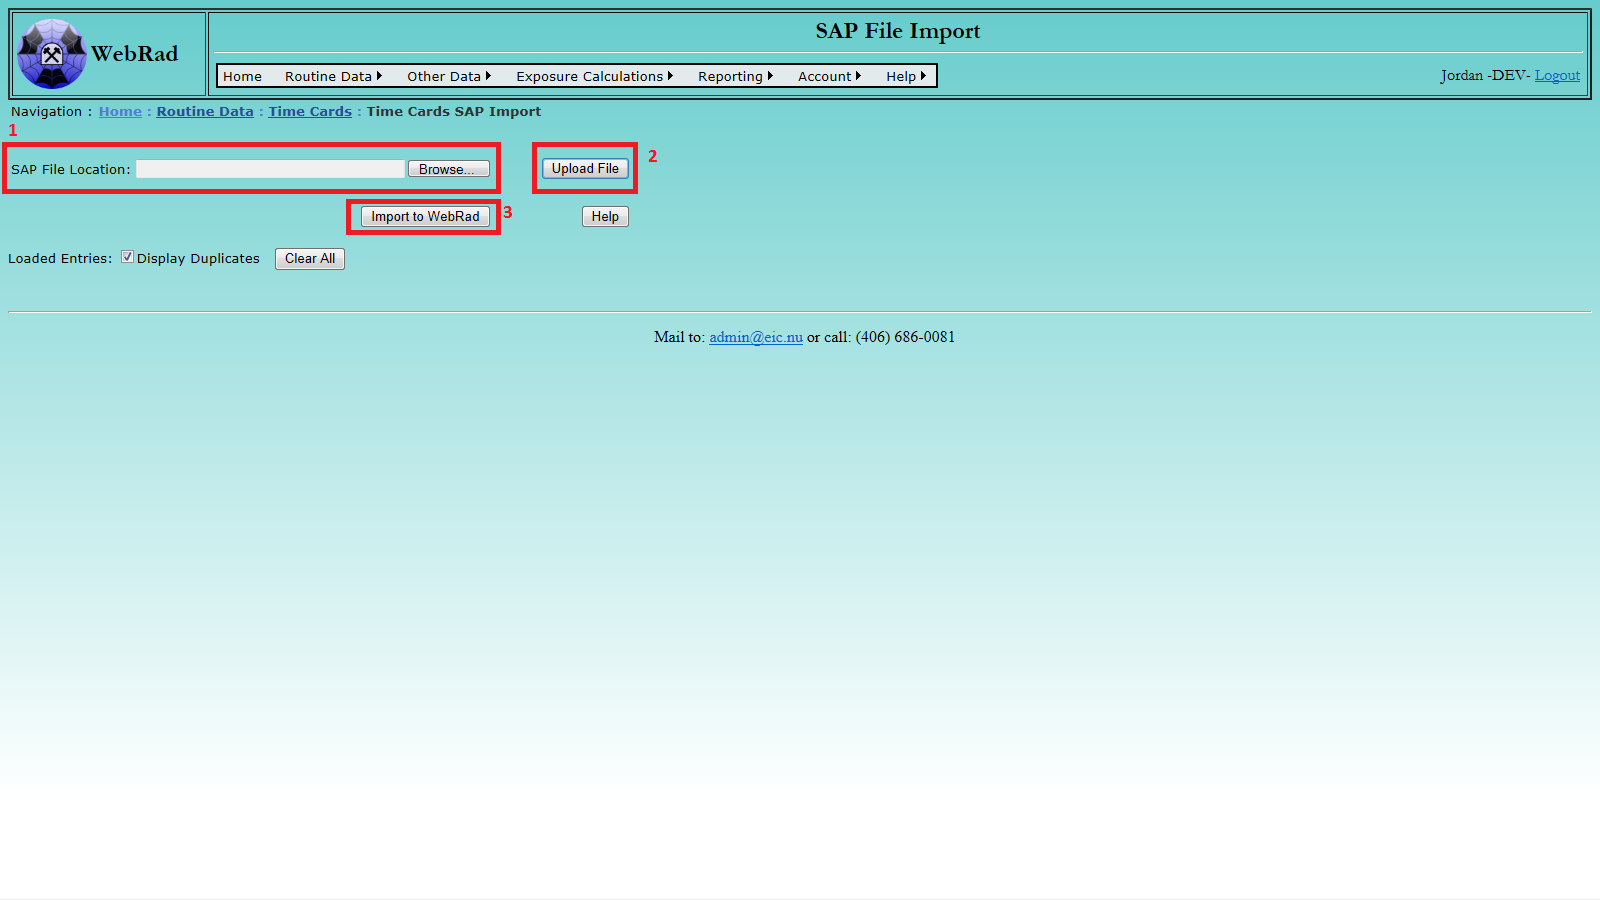
Locate the target SAP file using the pop-up browsing window: select file, then click Open.
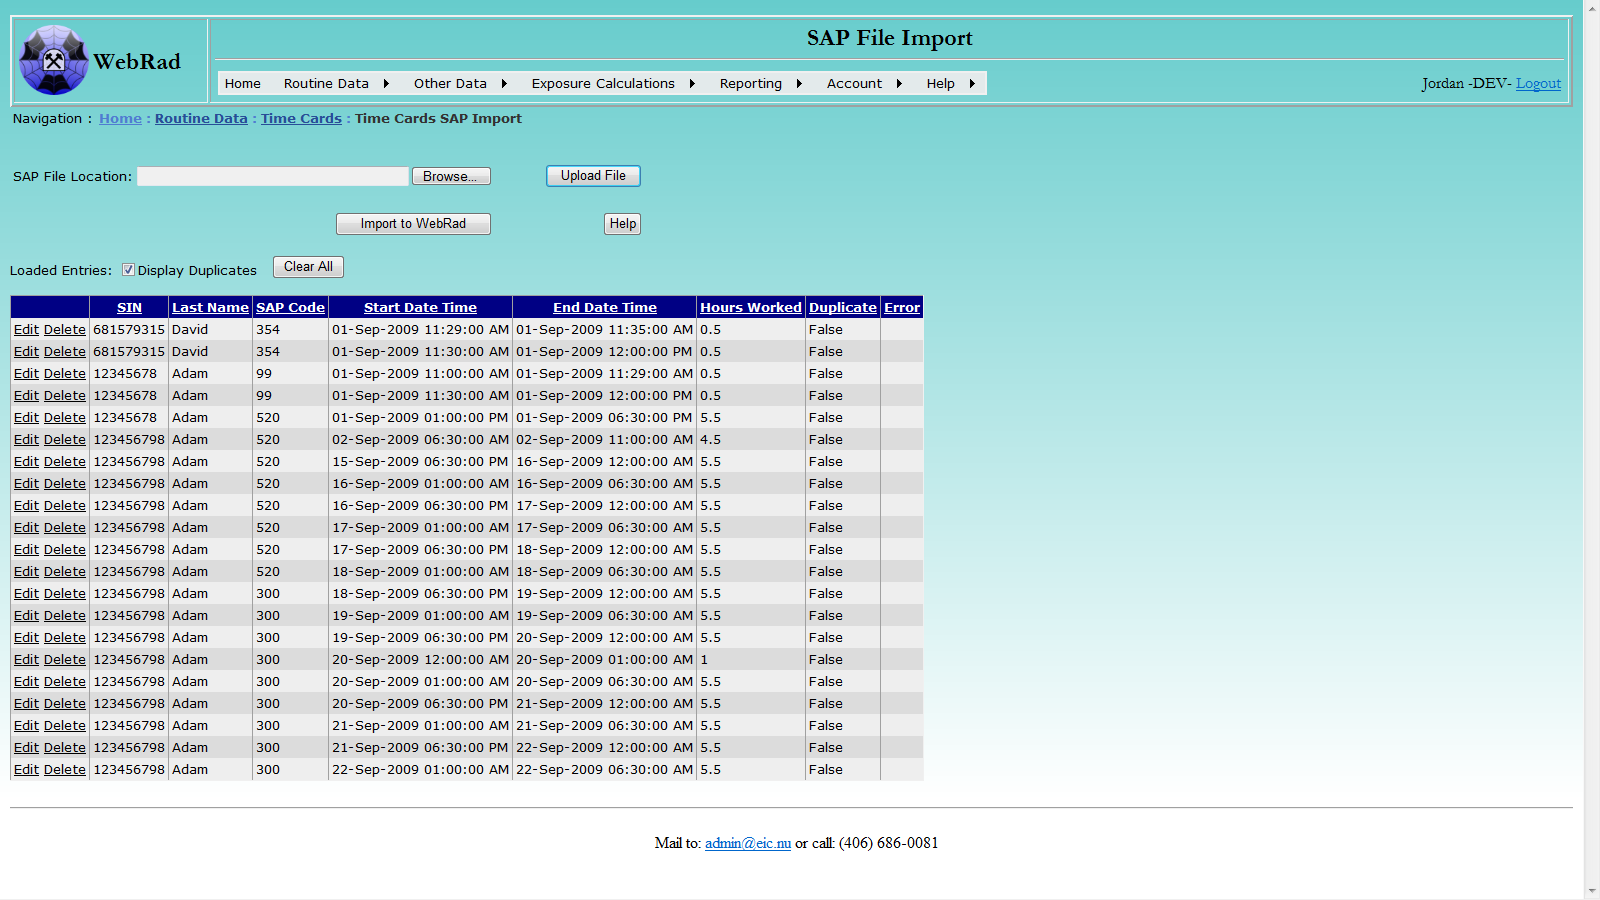
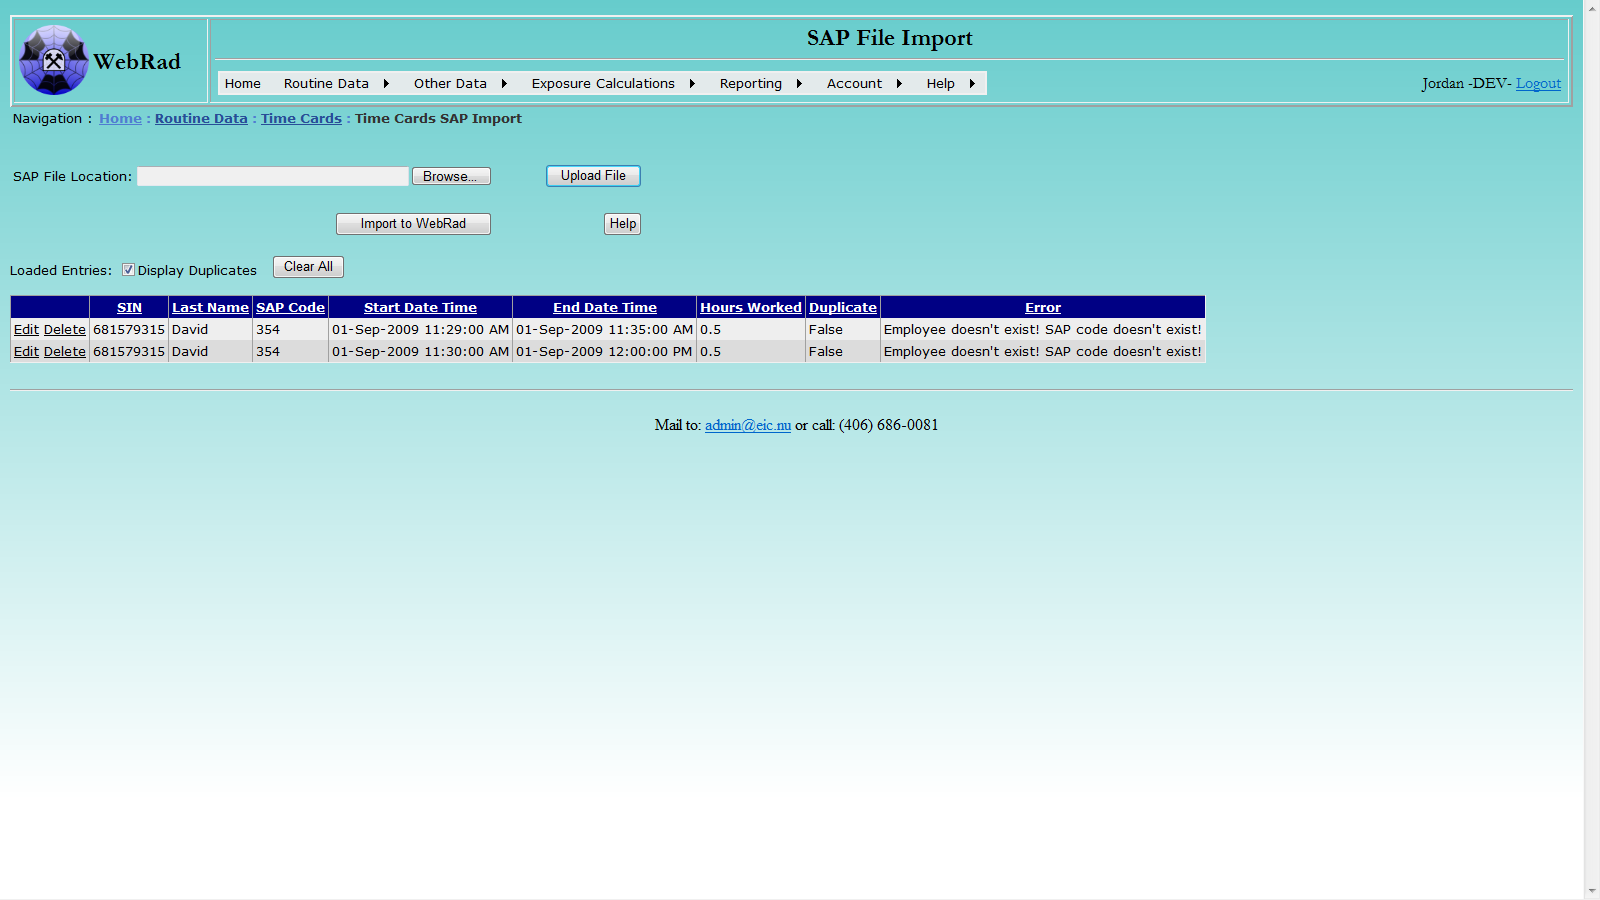
Click the Upload File button to upload the selected file. After successful uploading, the loaded records will be displayed. A record with non-empty Error column indicates that the corresponding record in the selected file is not correct. The comment message explains what the issue is with the record. You can directly edit or delete any record in the displayed data table. Please note: the uploading process may take a while if the selected file contains a large number of records.
Click the Import to WebRad button to import the records into the system. Please note: record(s) with non-empty comment message will not be imported. If a time card record from the selected SAP file spans over one day, the record will be broken down into two records with the two respective days. If any issue arises during importing a record, for example, SAP code does not exist in the system or the time duration in a record overlaps with any existing record in the system, the record will not be imported, and a detailed message about the issue will be presented in the Comment column. In that case, you can edit the record and try to re-import.
9. Personal Readings
9.1 Personal Readings Information Structure
There are two different methods for exposure information to be entered. The first is dosimetry area readings, which are entered via the "Direct Entry Readings", "Calculated Readings" and "LLRD Entry" screens. These readings are used in conjunction with worker time cards to calculate exposures. The second method is to use personal readings. Personal readings allow exposure readings to be entered directly for an employee based on results of a personal dosimeter that can span one or many days. Each contaminant is configurable as to whether dosimetry area readings or personal readings are used for exposure calculations, though appropriate entry methods must be created to utilize either. In addition to exposure readings, personal readings can also be used to input any other type of generic employee readings, whether based on a contaminant or not.
The Personal Readings Entry page will automatically show the 15 latest Personal Readings (all types). In order to change the headings of the columns to match the parameters of specific reading types, use the drop down at the top of the page to select the method you desire. To edit or filter the data, "Edit/Filter Readings" button can be clicked. It will redirect to a new page where readings can be edited, deleted and filtered with different filter options.
There are two pages which can be used to enter Personal Readings manually. They are the "Personal Readings Entry" and "Personal Readings Bulk Entry" pages. Both follow similar design, the main differece being that the bulk page allows multiple similar readings to be entered in a single run.
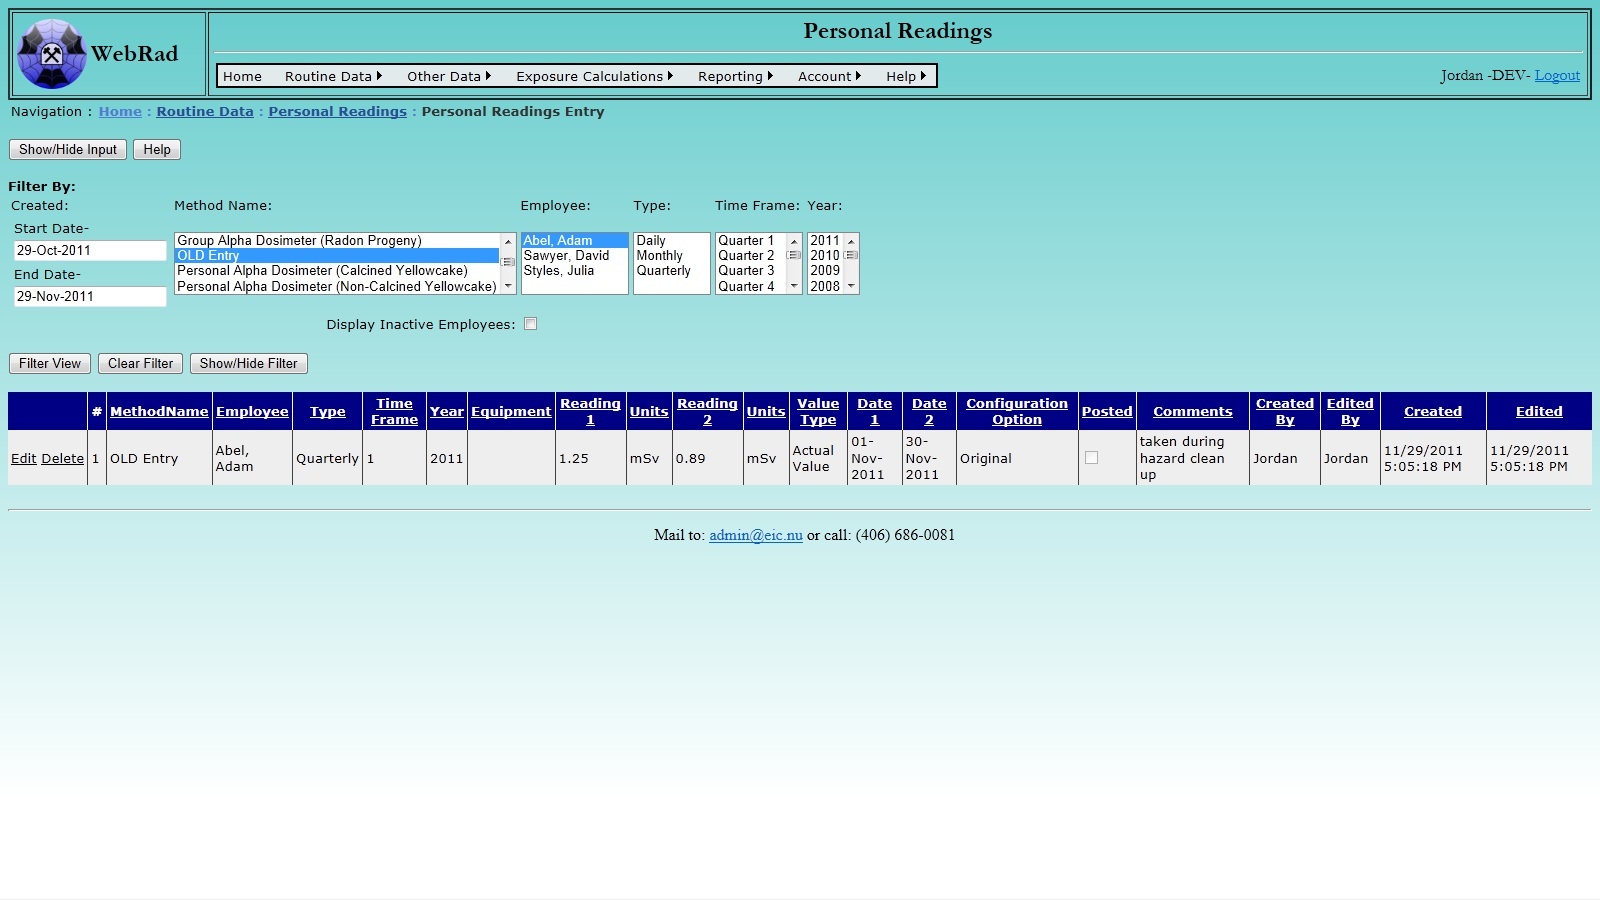
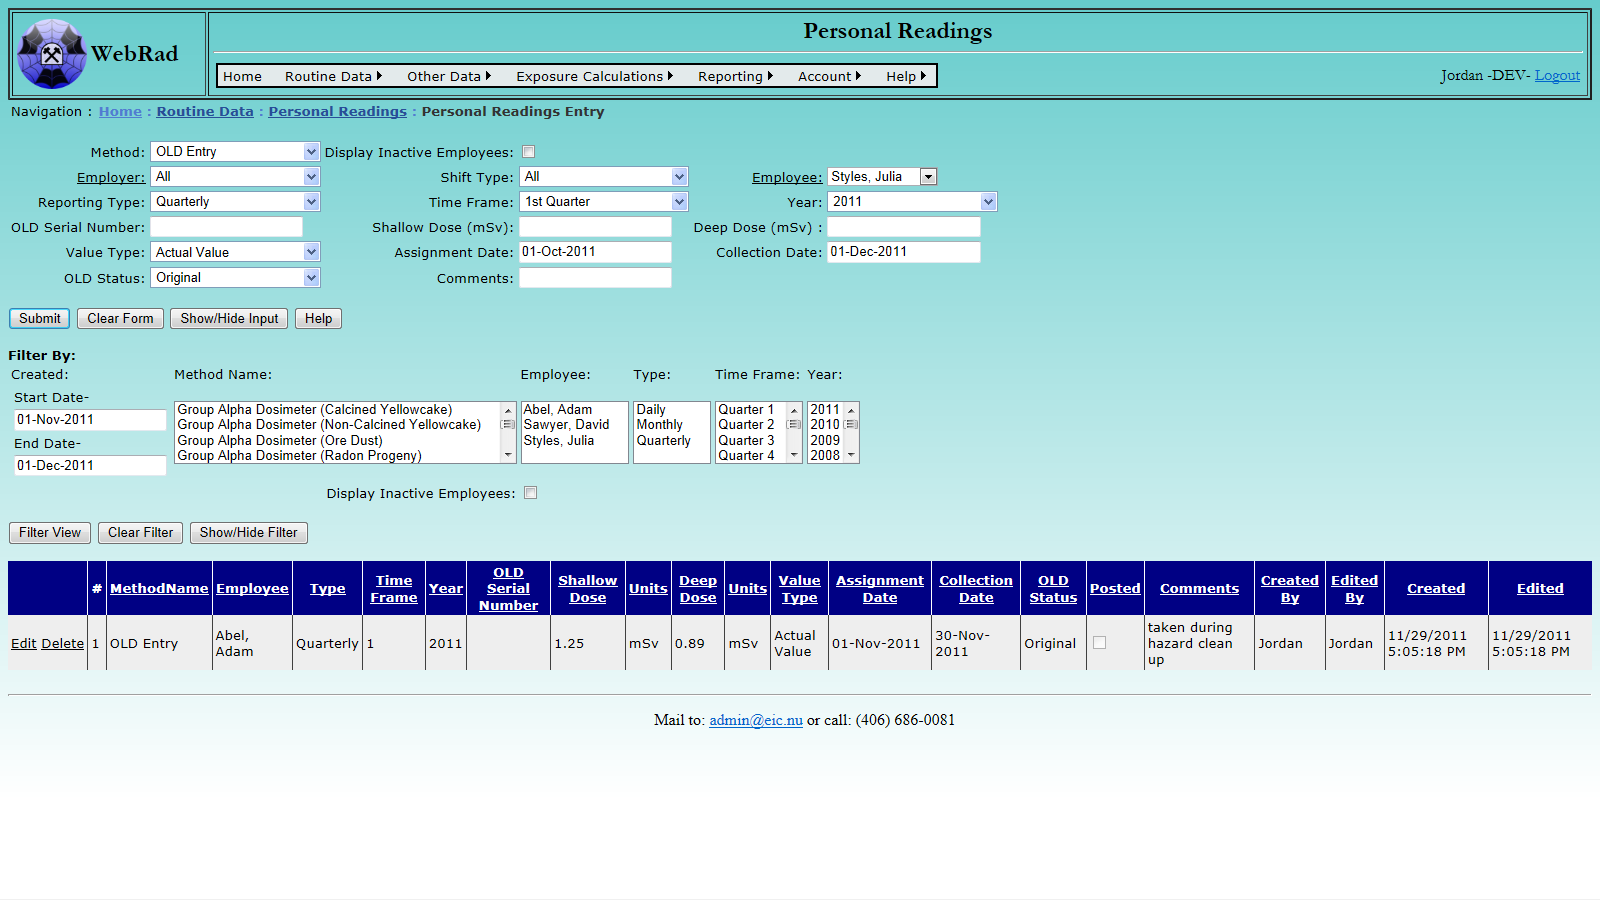
9.1.1 Personal Readings Entry
Mouse over "Routine Data" on the menu bar, go down to "Personal Readings", go over and click on the "Personal Readings Entry" link. The first thing to select on this page is the Method that corresponds to the reading being entered. Once a method is choosen, the page will refresh for entry specific to that method.
Select either an "Employer" or "Shift Type" will allow for filtering of the "Employees" list. Once an employee is selected, set the corresponding "Reporting Type", "Time Frame", and "Year". These values are used as additional information for book keeping means. Selecting a "Reporting Type" of daily/monthly populates the "Time frame" with a selection of months, whereas selecting a "Reporting Type" of quarterly populates the "Time frame" with a selection of quarters.
Next, enter the reading data. Make sure to enter the readings in the corresponding units displayed. Specify the date, or date range, that the reading corresponds to. If the reading will be used in exposure calculations, there will always be a starting and ending date. These correspond to the range of time where that Personal Reading will be used. If a reading is to be used only for one day, set the start date and end date to the same value. Enter the equipment name, comments, and any other required data, then click the "Submit" button. The record will load into the grid view below when the page refreshes.
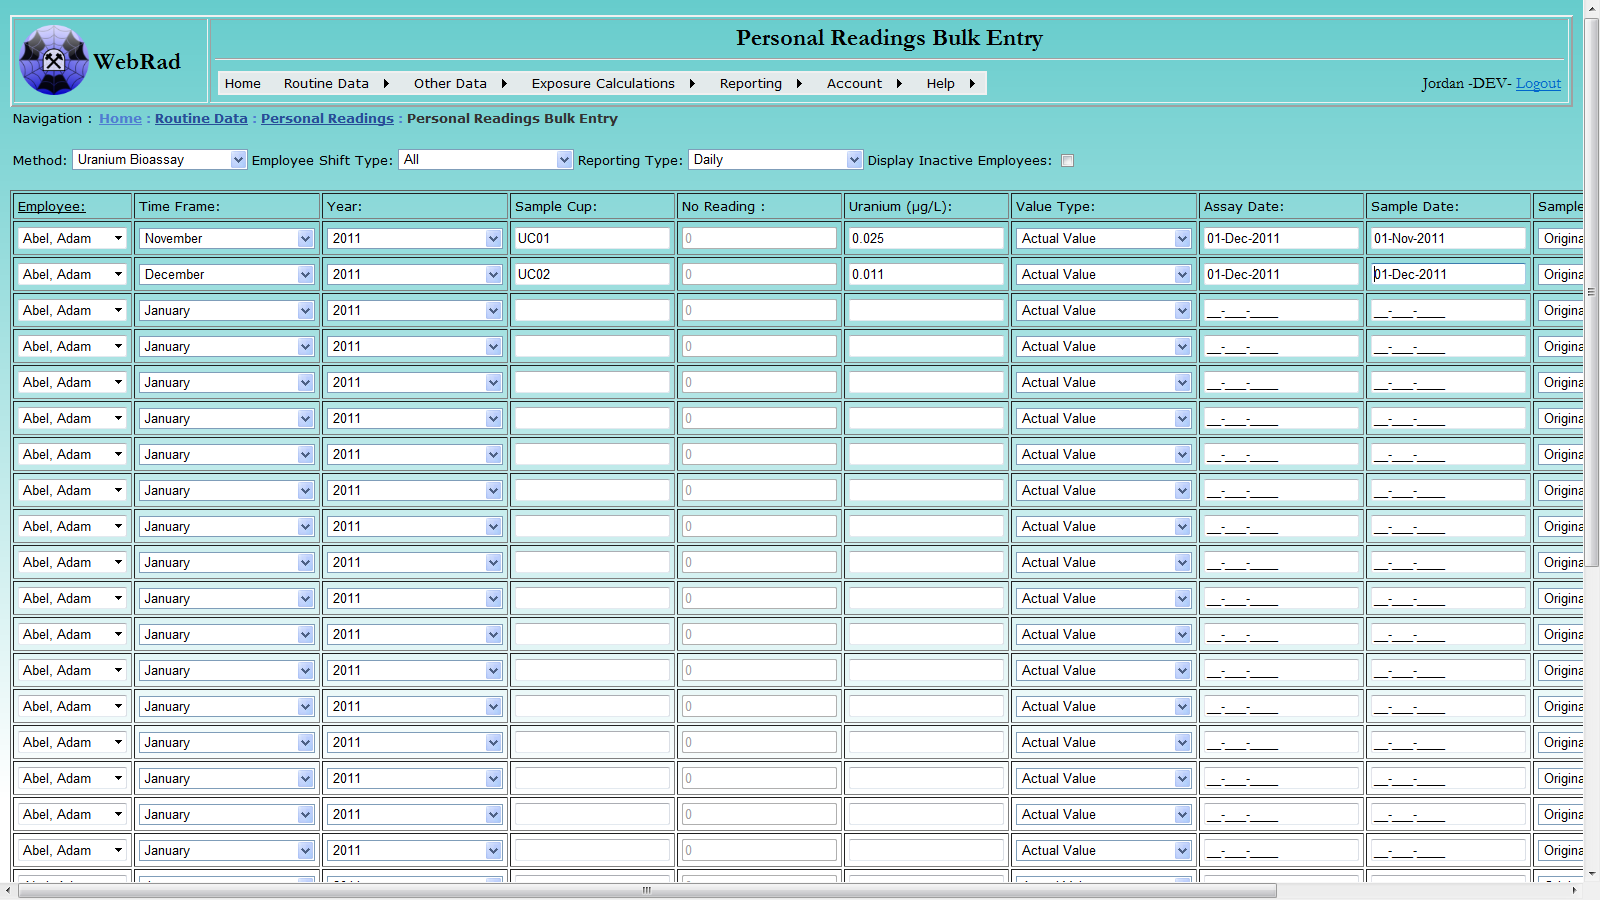
9.1.2 Personal Readings Bulk Entry
Mouse over "Routine Data" on the menu bar, go down to "Personal Readings", go over and click on the "Personal Readings Bulk Entry" link. The first thing to select on this page is the Method that corresponds to the readings being entered. Once a method is choosen, the page will refresh and all input with have their labels set to that particular method. The next two things to be selected on this page are the employee "Shift Type" and "Reporting Type". The "Shift Type" is used to filter the employee drop down boxes and the "Reporting Type" is used to populate the "Time Frame" drop down boxes. Selecting a "Reporting Type" of daily/monthly populates the "Time frame" with a selection of months, whereas selecting a "Reporting Type" of quarterly populates the "Time frame" with a selection of quarters.
Once the setup data is completed, you may begin to enter the individual readings. Fill in all required data for each row and then click on the "Submit Readings" button. Any readings without errors will load into the database and be displayed in the grid view below when the page refreshes. Any readings that contain errors will remain in the bulk rows with a corresponding error message to the far right of the entry.
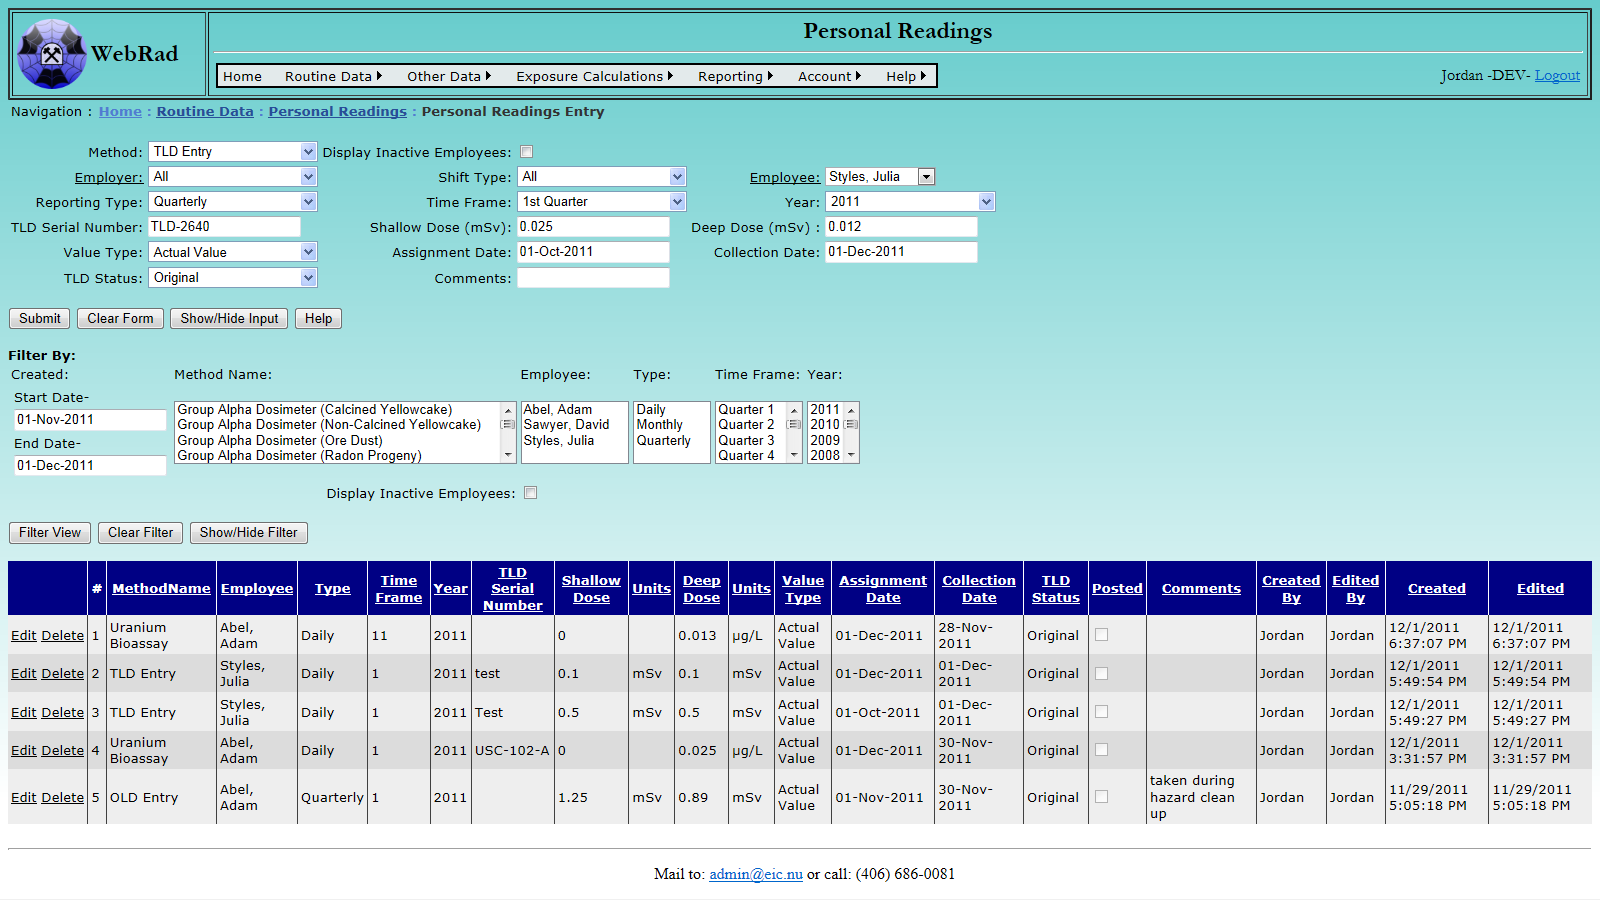
9.2 Entering TLD Readings
Mouse over "Routine Data" on the menu bar, go down to "Personal Readings", go over and click on the "Personal Readings Entry" link. From the Method list choose the entry corresponding to entering TLDs.
Next choose an employer, this will automatically populate the employee list with all employees associated with that employer. If the employer is unknown at the time, a selection of "All" is avaiable to show employees regardless of employer. The shift type can also be used to narrow down the select list of employees. After selecting an employee, enter the assignment and collection dates for the TLD. This is the range of days that the TLD dose will be used for during exposure calculation. Note that the second reading ("Deep Dose") is the only one which will be used in exposure calculations.
Enter the rest of the TLD report information, note that the dose units are mSv. Choose the method for the doses. Actual value means that the value came directly from a TLD report, while estimated means that the actual dose value is unknown and an estimate is being used.
TLD Status indicates whether the TLD for the current record is the original assigned to the employee, or a replacement. Note that the "Time Frame", "Reporting Type", and "Year" currently have no purpose other than being used for book keeping.
Enter any comments, and click the "Submit" button. The successfully loaded record will appear in the grid view below.
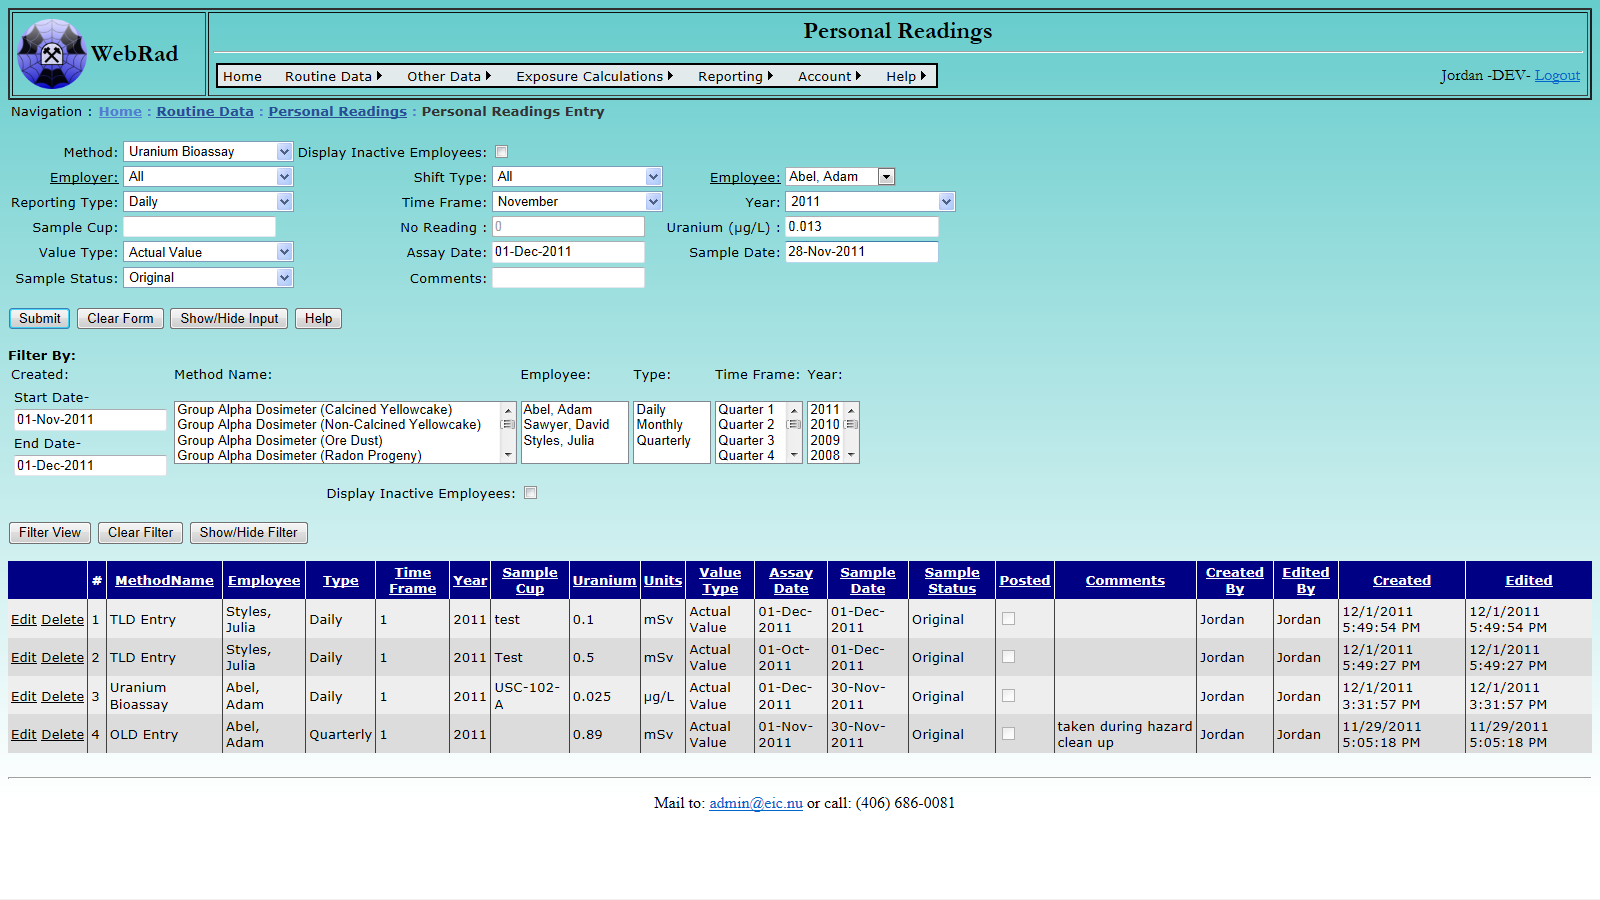
9.3 Uranium Bioassay
Mouse over "Routine Data" on the menu bar, go down to "Personal Readings", go over and click on the "Personal Readings Entry" link. From the Method list choose "Uranium Bioassay". Note that these entries are for reference and reporting purposes only, and are not used for any exposure calculations.
Next choose an employer, this will automatically populate the employee list with all employees associated with that employer. If the employer is unknown at the time, a selection of "All" is avaiable to show employees regardless of employer. The shift type can also be used to narrow down the select list of employees.
If necessary, enter the sample cup number, otherwise, leave the equipment box blank. Enter the employees uramium reading in µg/L. Choose the method for the reading. Actual value means that the value came directly from a uramium bioassay report, while estimated means that the actual value is unknown and an estimate is being used.
Enter the sampling and assay dates for the reading. The Sample entry indicates if the reading is an original sample, or a re-sample.
Enter any comments, and click the "Submit" button.The successfully loaded record will appear in the grid view below.
9.4 OLD Import
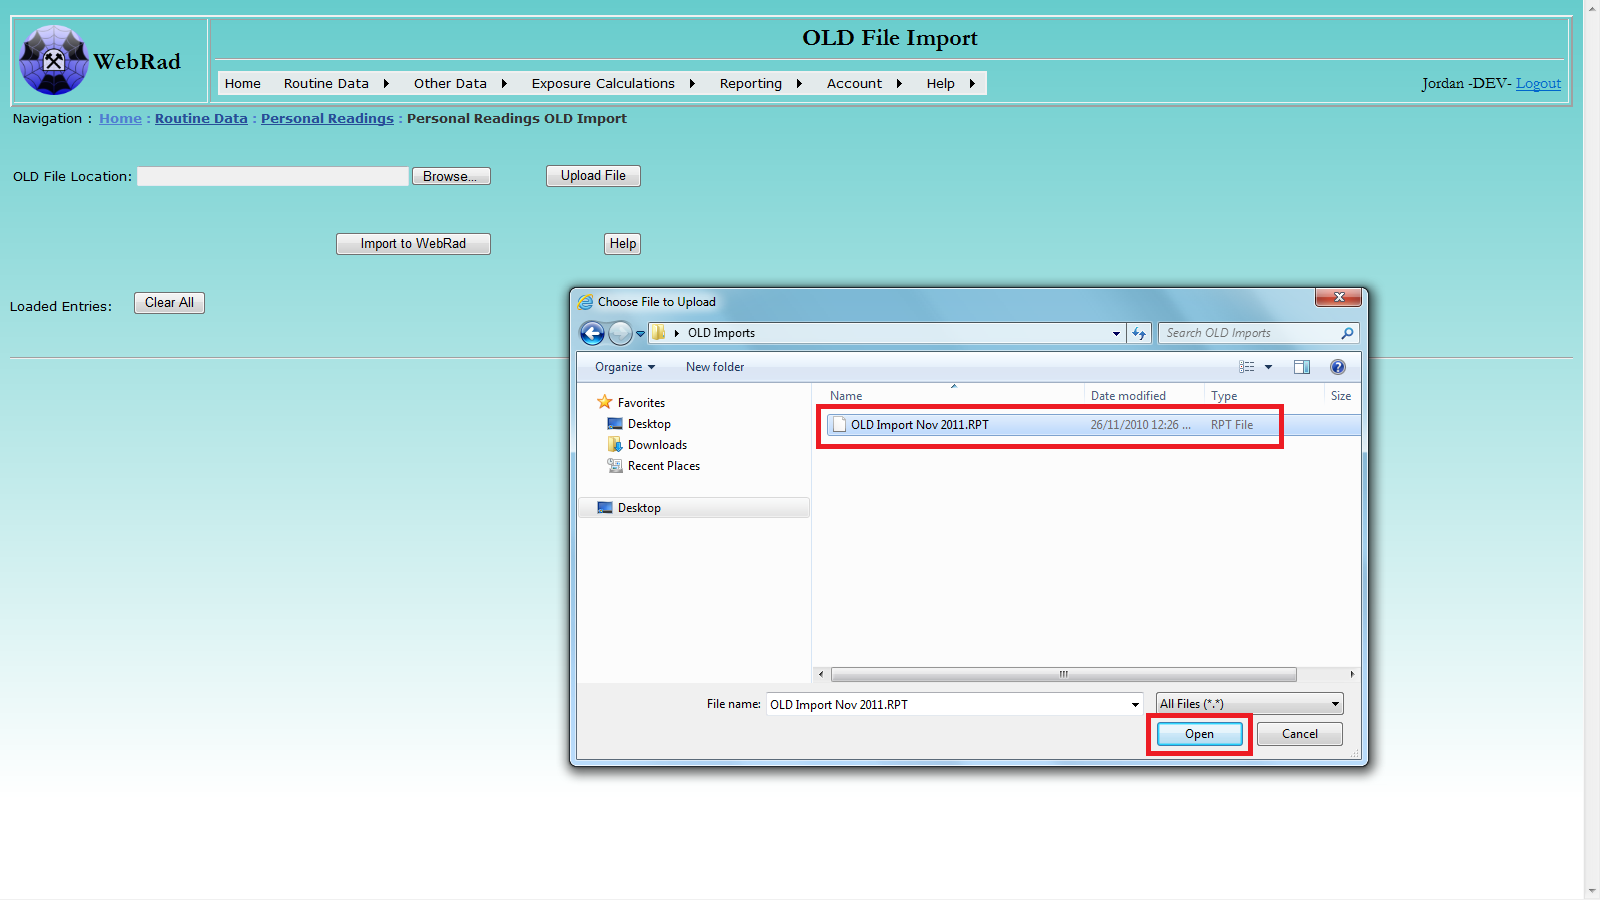
To import OLD entries from a .RPT file, follow four convenient steps:
- Clear any exisiting OLD entries.
- Locate the .RPT file from your disk.
- Upload the file into WebRad's temporary storage.
- Import the loaded records into WebRad.
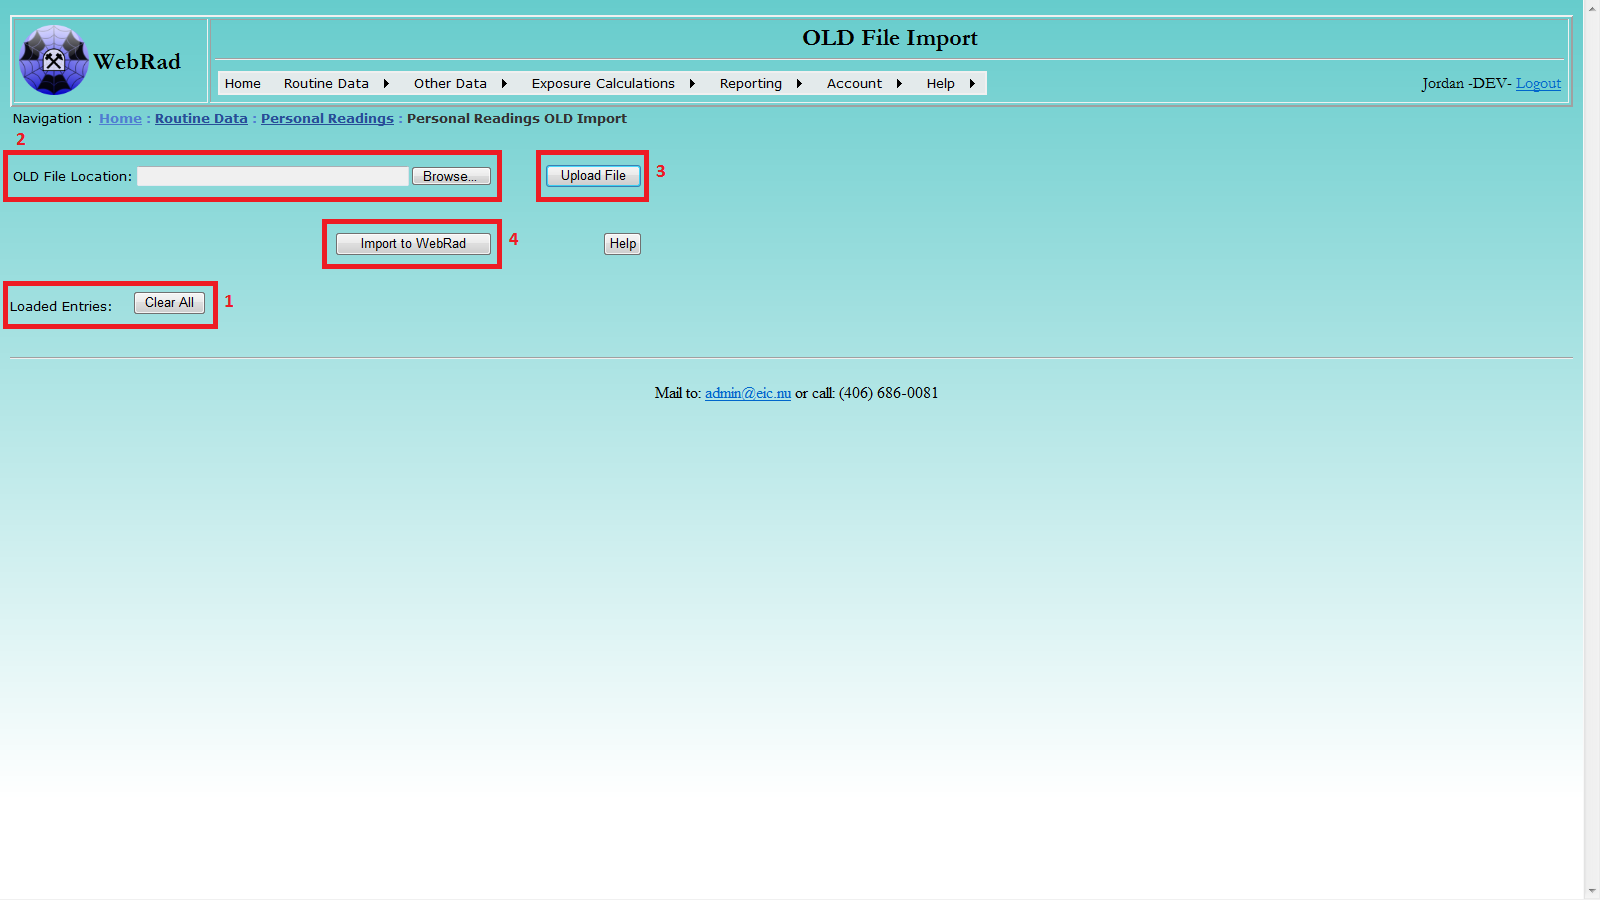
Locate the target OLD file using the pop-up browsing window: select file, then click Open.
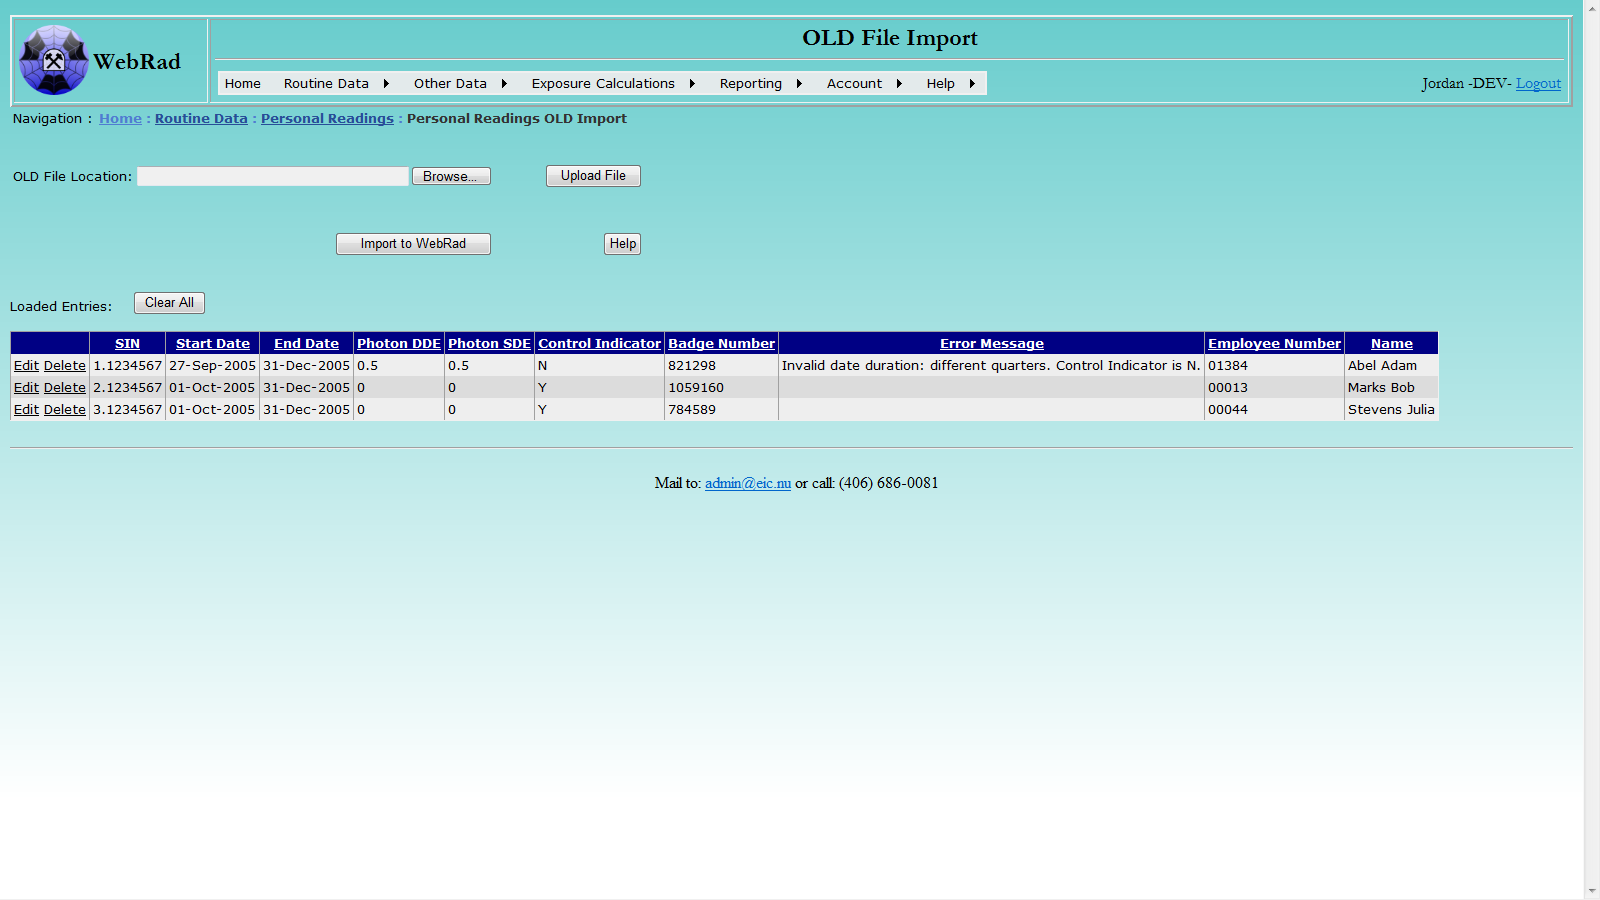
Click the Upload File button to upload the selected file. After successful uploading, the loaded records will be displayed. A record with non-empty Error Message column indicates that the corresponding record in the selected file is not valid. The message explains what the issue is with the record. You can directly edit or delete any record in the displayed data table. Please note: the uploading process may take a while if the selected file contains a large number of records.
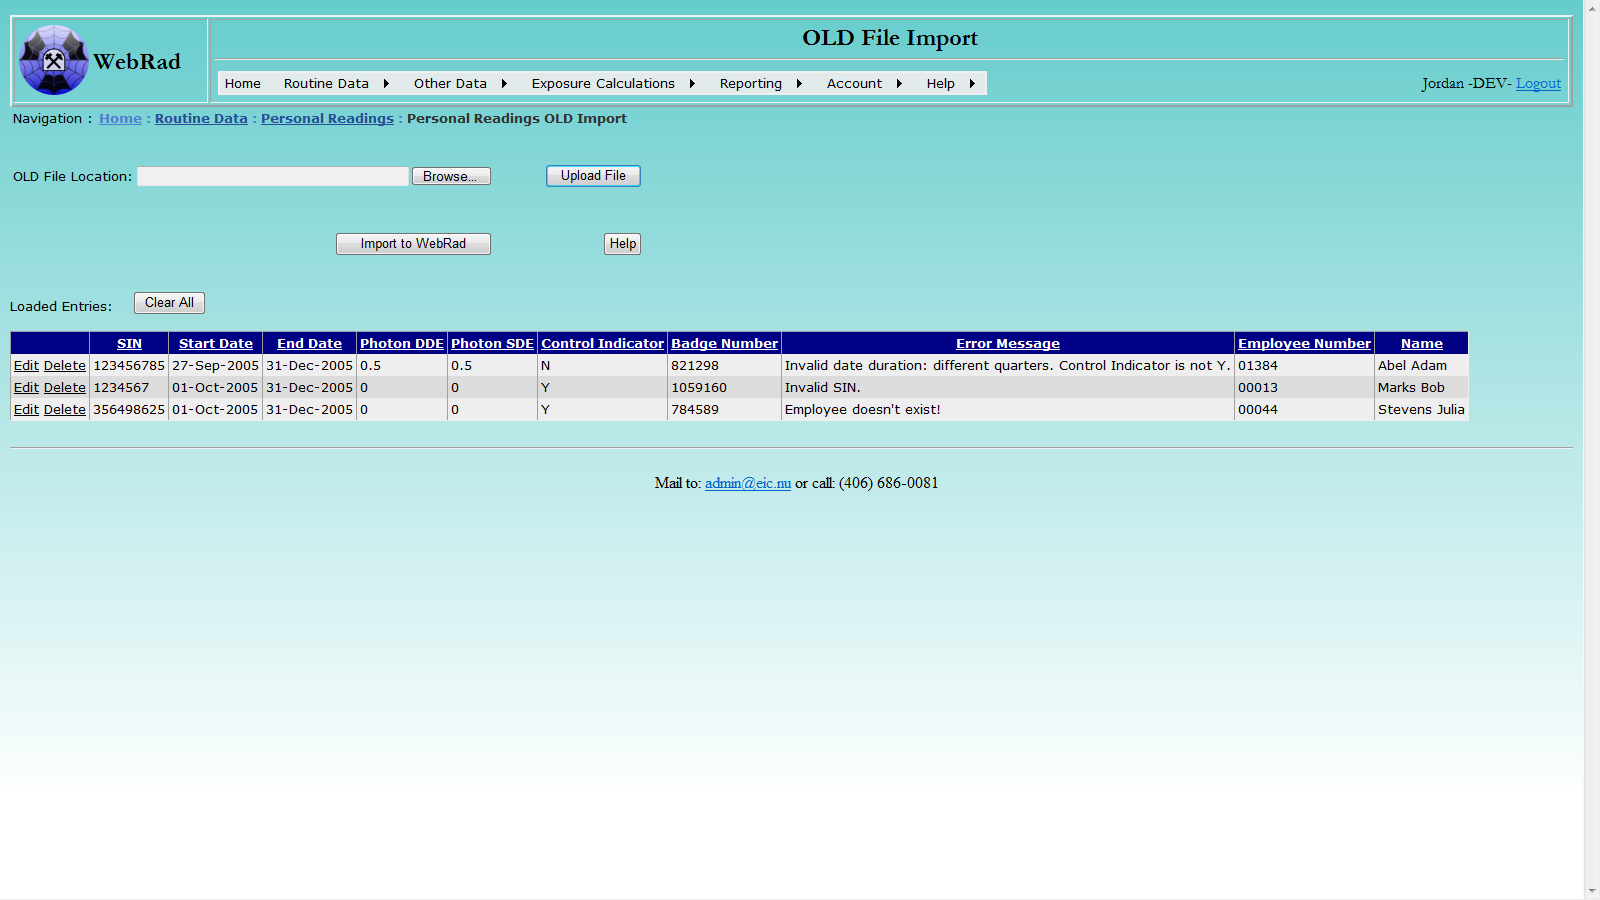
Click the Import to WebRad button to import the records into the system. Please note: record(s) with non-empty comment message will not be imported. If any issue arises during importing a record, for example, an employee does not exist in the system or the time duration in an OLD record overlaps with any existing record in the system, the record will not be imported, and a detailed message about the issue will be presented in the Error Message column. In that case, you can edit the record and try to re-import.
9.5 Creating PADs
The Creation of a PAD in WebRad is a two part process. First a PAD with associated head number must be created as a piece of Personal Readings Equipment. After it has been created, transactions must be generated for the PAD such as an assignment date, a collection date, associated employees, pressures, etc. Only when all required transactions are assigned to an active PAD will that PAD be eligible for export to a vendor to obtain results which may then be imported into WebRad.
9.5.1 Creating PAD as Equipment
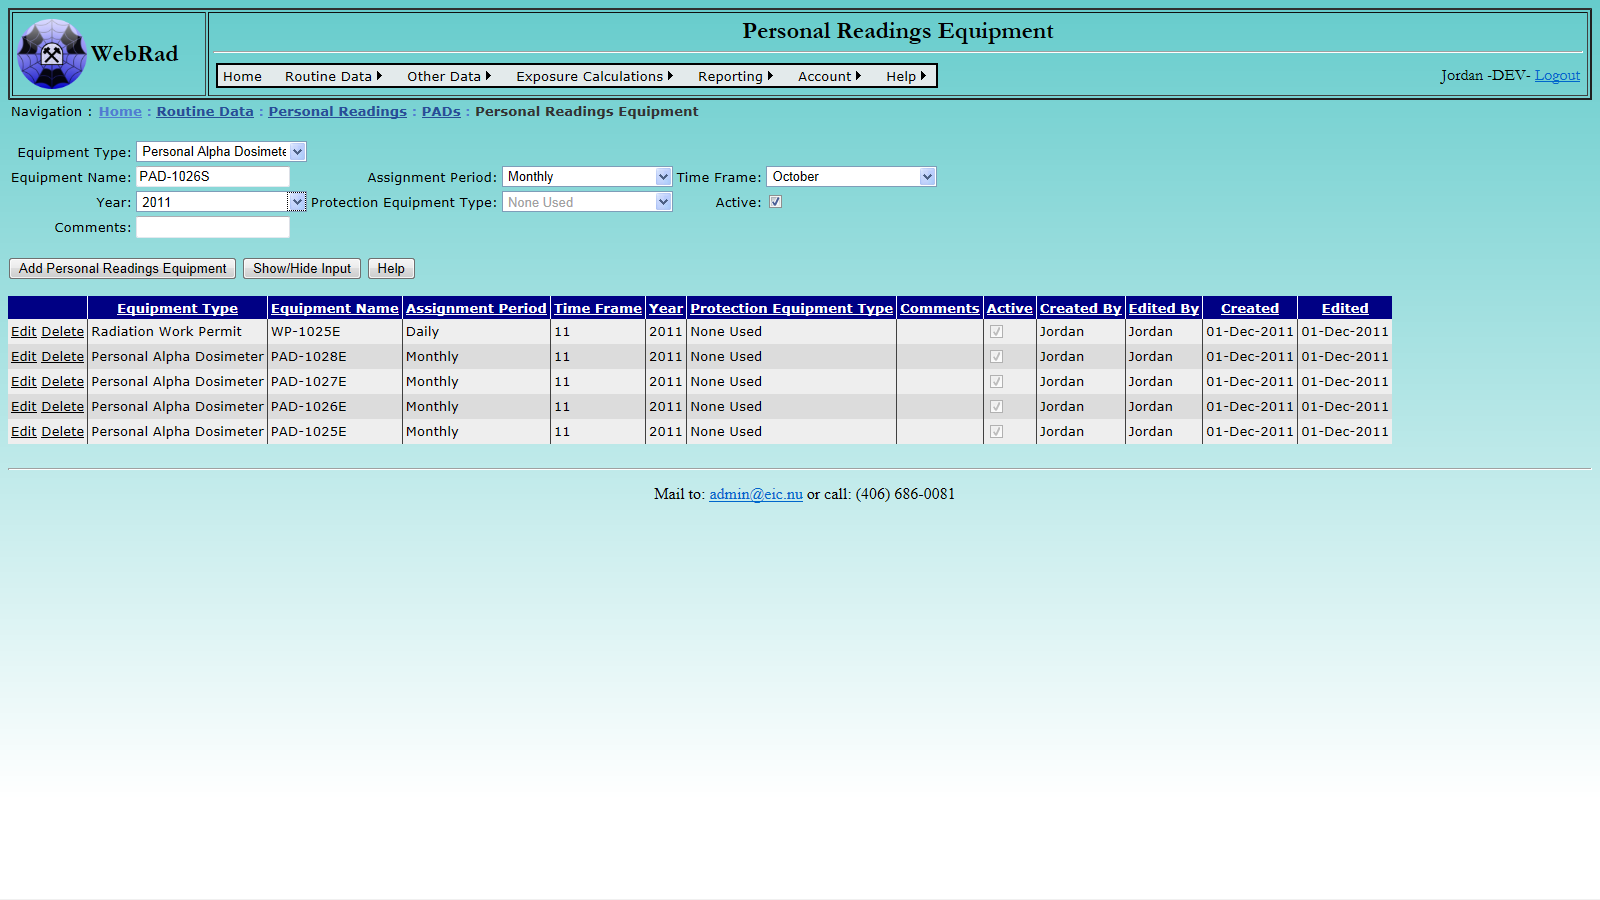
Mouse over "Routine Data" on the menu bar, go down to "Personal Readings", go over to "PADs" then click on the "Personal Readings Equipment" link. From the "Equipment Type" drop down list, select "Personal Alpha Dosimeter". In the "Equipment Name" text box type the head number of the PAD you are entering. Choose the "Assignment Period" and associated "Time Frame". The year may also be selected at this time and any comments may be entered for the PAD. Note that the "Assignment Period", "Time Frame", and "Year" are used solely for book keeping purposes. Make sure that the "Active" check box is selected (only active equipment shows up in drop down boxes) and click on "Add Personal Readings Equipment". The grid view below will refresh with your newly created PAD.
9.5.2 Generating PAD Transactions
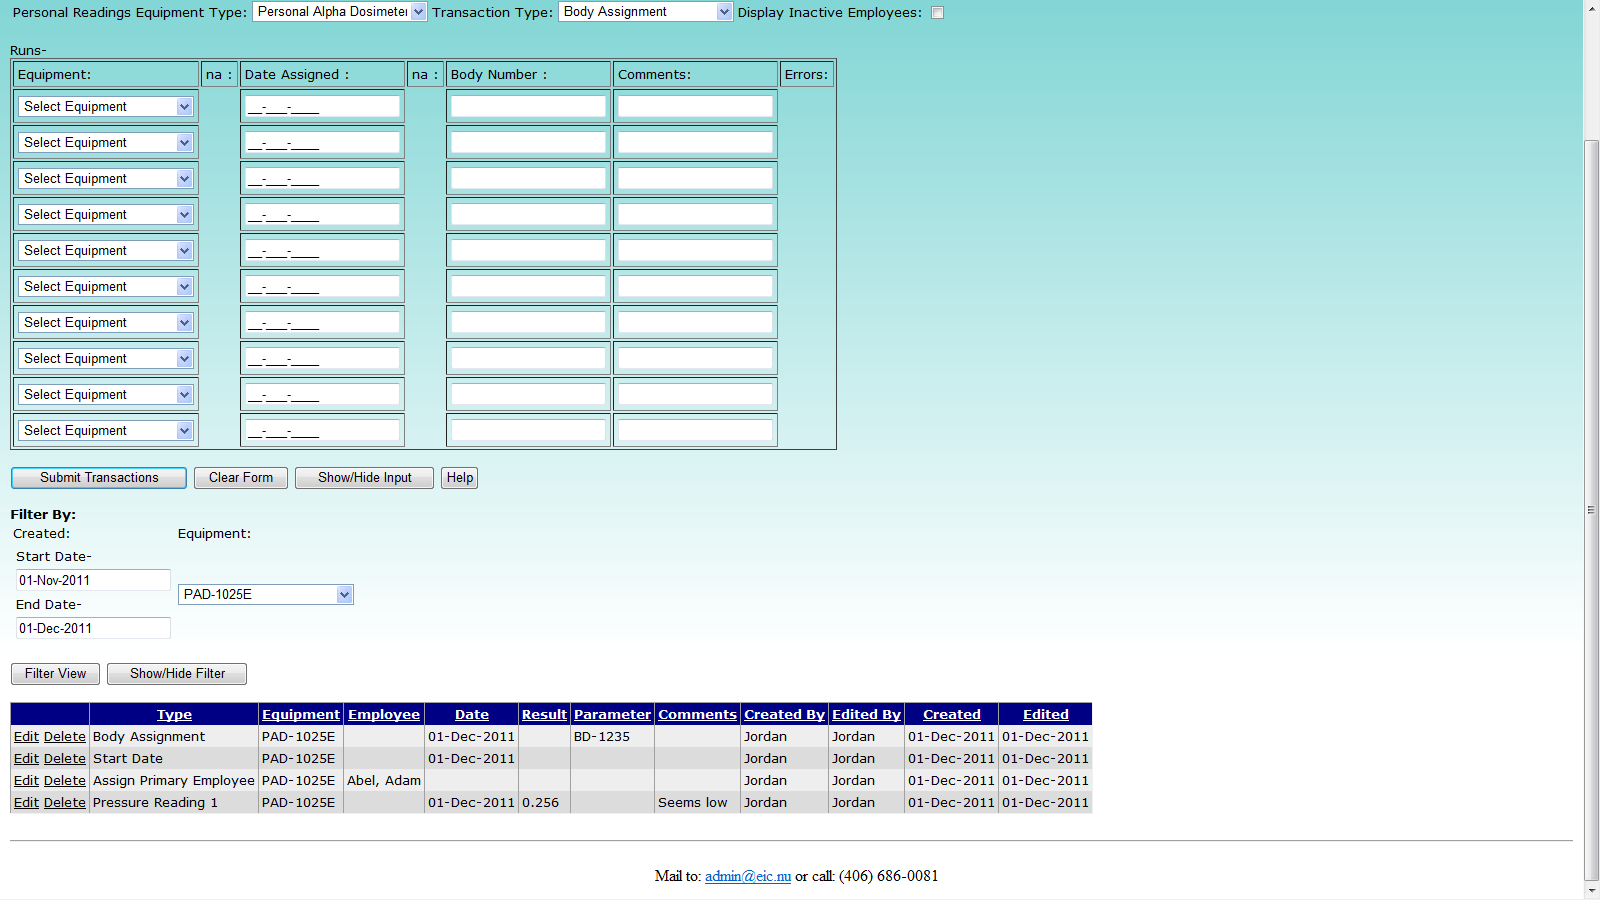
Once a PAD has been created and is set to "Active" it can then have transactions associated to it. Mouse over "Routine Data" on the menu bar, go down to "Personal Readings", go over to "PADs" then click on the "Personal Readings Transactions Bulk" link. The first requirement is to select "Personal Alpha Dosimeter" from the "Personal Readings Equipment Type" drop down box. The choices for the "Transaction Type" drop down box will be refreshed with all of the transactions that are associated to PAD's. Select the transaction you wish to enter. The entry form below will adjust to allow only required fields to appear for data entry. If the transaction allows for employees to be selected you may use the "Display Inactive Employees" check box to get a list of all possible employees. On the left of the entry screen choose a PAD from the "Equipment" drop down box. You must choose a different PAD for each line unless the transaction type is set to "Assign Group Employee", in which case multiple lines can be filled with the same PAD. Fill in all of the entries for that line and then click on the "Submit Transactions" button to create the entries. The grid view below will refresh with the new entries populated. If an error occurs during an entry, that entry will remain on the entry screen and an associated error will be displayed to the right.
![]()
This page also includes a filter which allows all transactions for an associated piece of equipment to be displayed. The "Show/Hide Filter" button may be used to bring up the filtering options if they are not currently displayed. All transactions have a "Created" date associated to them. The filter allows transactions to be displayed based on when they were created and for what piece of equipment they were created. Choose the filtering criteria and then click the "Filter View" button to have the grid view below display all of the associated transactions. From here transactions can be edited and deleted for a particular piece of equipment, however this should be avoided especially if the equipment is of the type "Radiation Work Permit", or the PAD has already been exported and is awaiting results.
9.6 PAD Export
Mouse over "Routine Data" on the menu bar, go down to "Personal Readings", go over to "PADs" then click on the "PAD Export" link. To export PAD entries to an Excel file, follow three convenient steps: select date range for PAD assignments, export, and save the file. As the date range for the PAD assignment transactions is being selected, available database records that are ready to be exported will be displayed. The export grid view will only find PAD's that are currently set to active. To the left of the grid view is a column that indicates if the record is available to be exported. A false value here means that it is missing critical data such as a primary employee, start/end dates, or has a non-numeric SIN. Similarly, to the far right of the grid view is a message column that notifies the user if an non critical data is missing as well. An example of non critical data would be pressures, so that if one is missing, the user will be warned but the export will still be allowed.
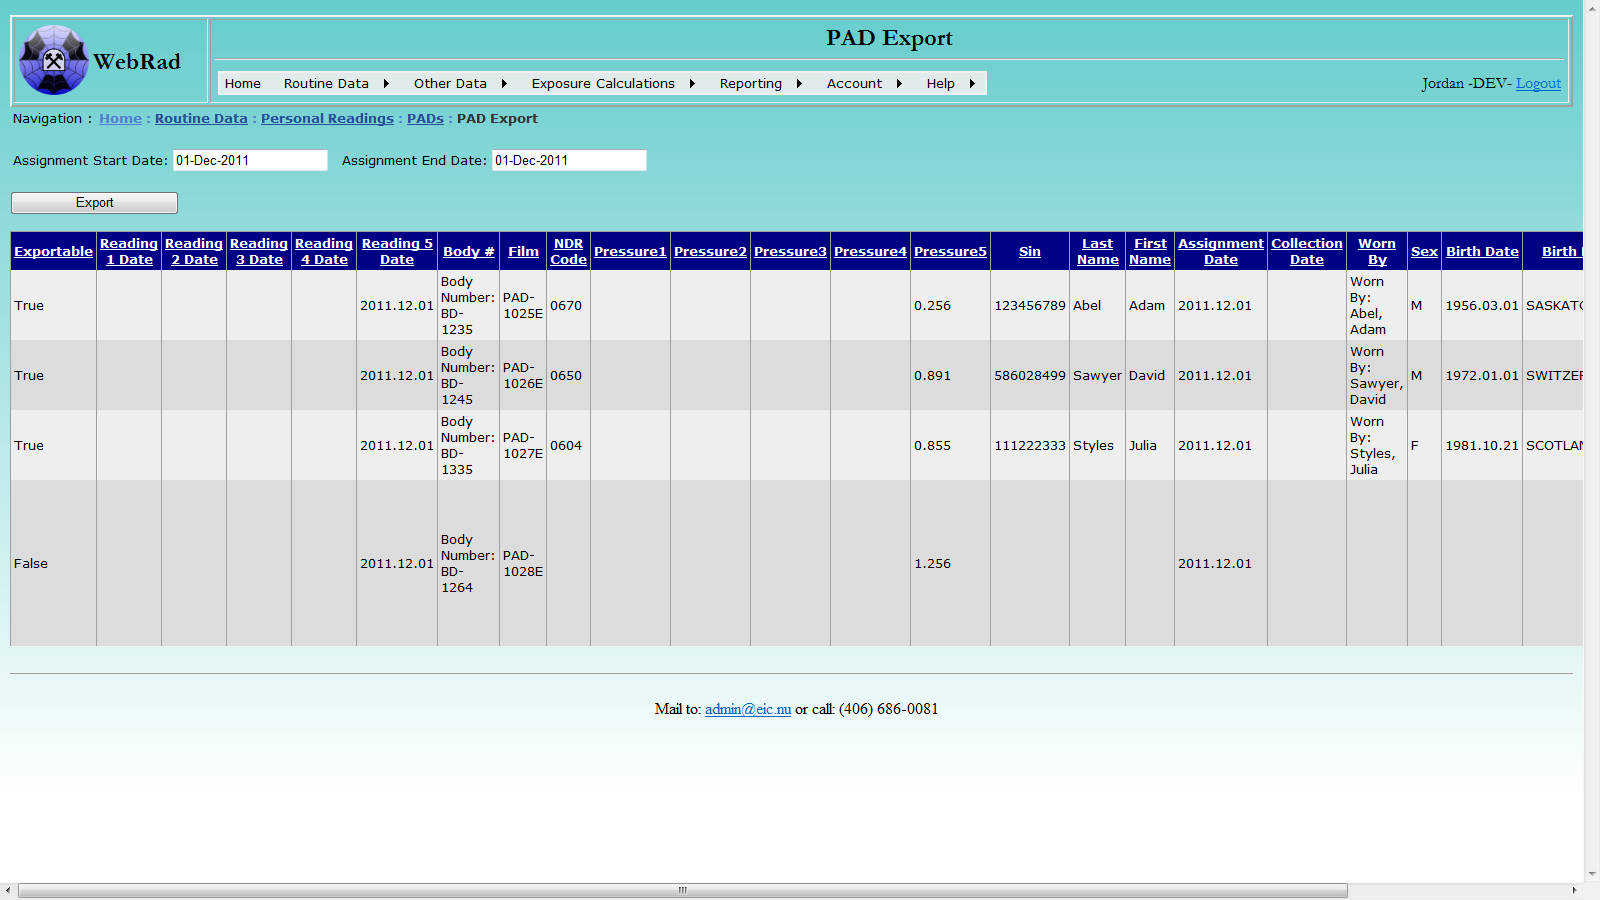
Click the "Export" button, a pop-up window will ask "Do you want to open or save this file?", click the "Open" button, the data will be displayed in Excel. Then the file can be save to your local drive with a proper name you give.
9.7 PAD Import
Mouse over "Routine Data" on the menu bar, go down to "Personal Readings", go over to "PADs" then click on the "PAD Import" link. To import PAD entries from an Excel file (.XLS), follow four convenient steps:
- Locate the .XLS file from your disk.
- Upload the file into WebRad's temporary storage.
- Check the uploaded data for errors.
- Import the loaded records into WebRad.
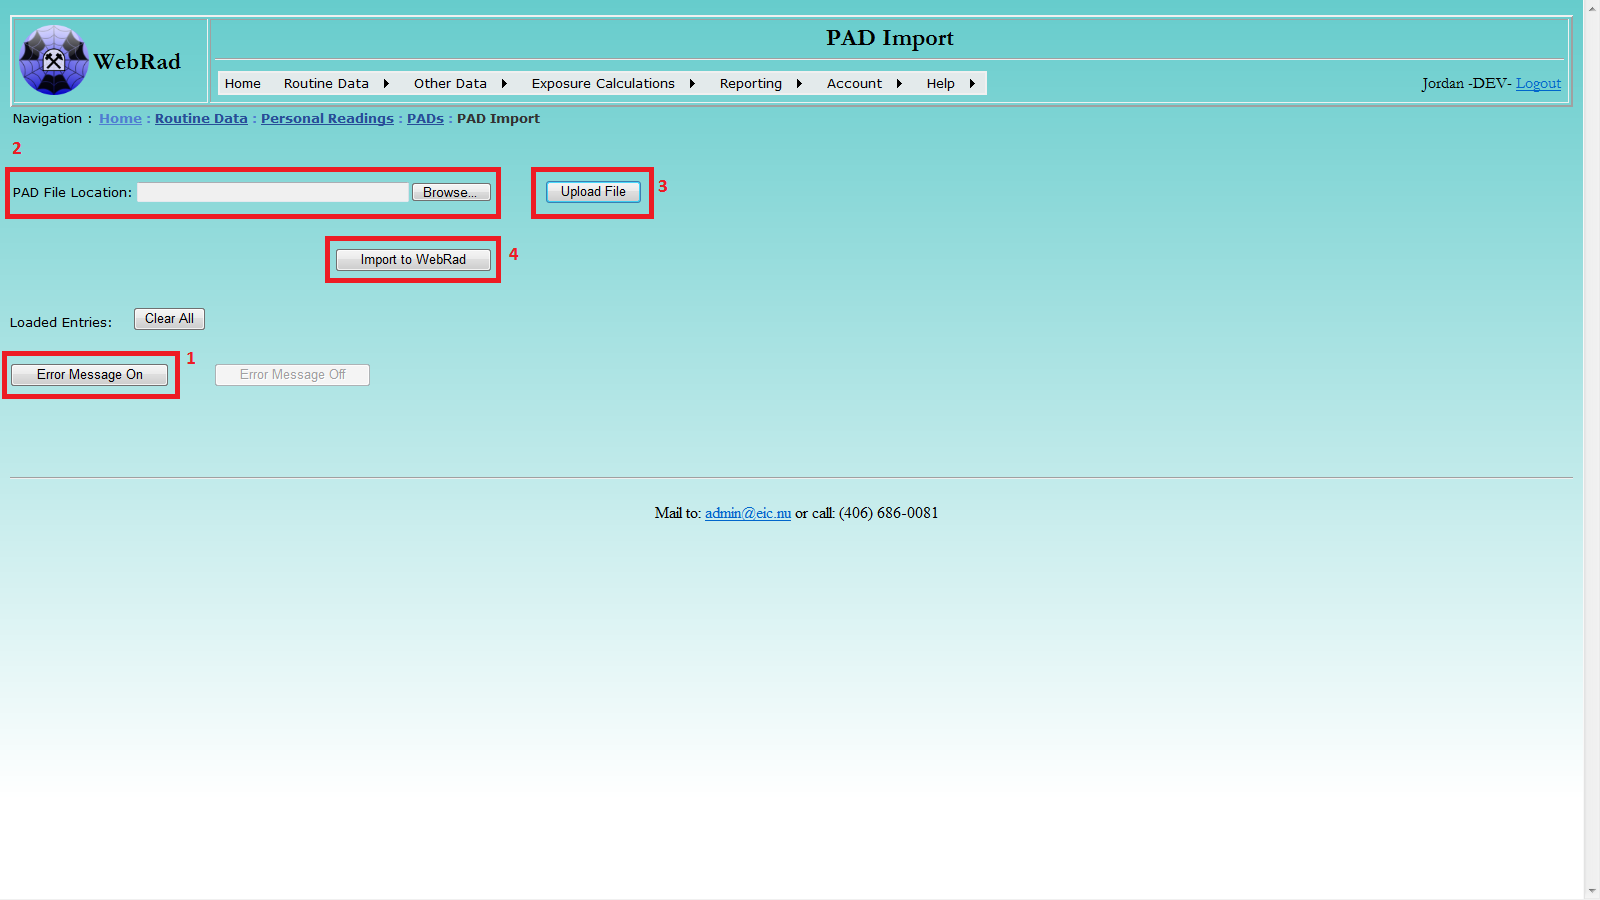
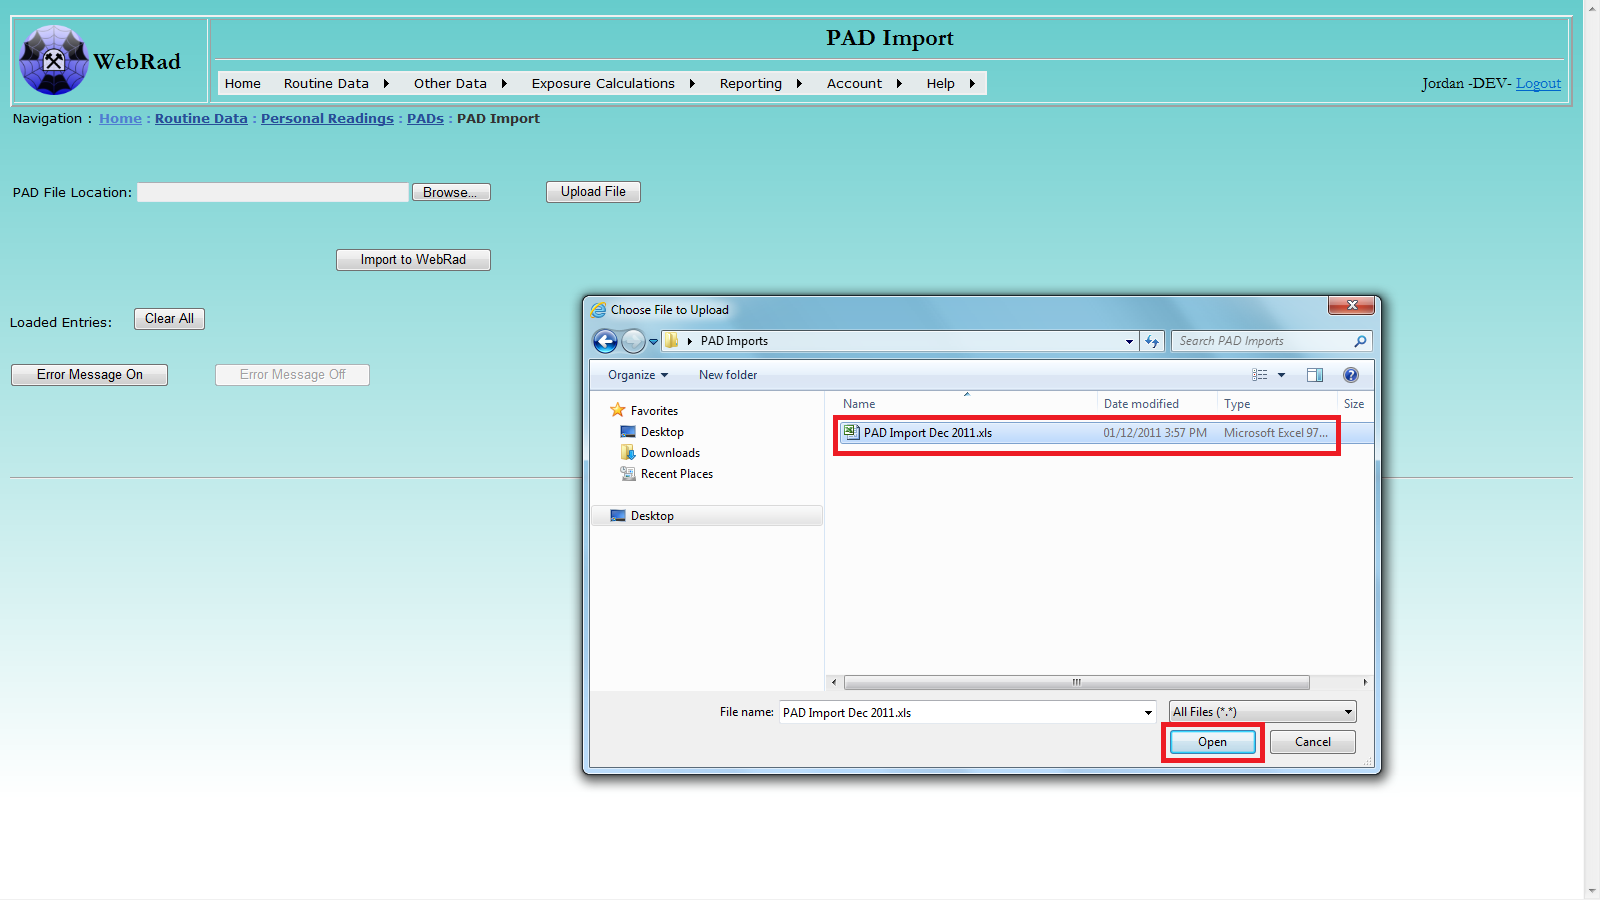
If any records currently exist in the temporary table make sure to first clear them out by using the "Clear All" button. Click on the "Browse" button to open Windows explorer. Locate the target .XLS file using the pop-up browsing window: select file, then click Open.
Click the "Upload File" button to upload the selected file. After successful uploading, the loaded records will be displayed. You can directly edit or delete the result value of any record in the displayed data table. Loaded entries are matched to existing active PADs by the Head Number, Assignment Date, and Collection Date. The people recieving the results will be those who where entered when the PAD was first created in WebRad. The loaded list should contain only the primary wearers of the PAD's. By default, PAD results that contain at least one LLRD measurement will automatically have all three types assigned with a default value of 0. This is used so that LLRD estimates are not generated for workers that wear their PAD in areas where types of LLRD are monitored. Please note: the uploading process may take a while if the selected file contains a large number of records. The "Clear All" button may be used to first remove any records that are in the table prior to uploading a new set of records
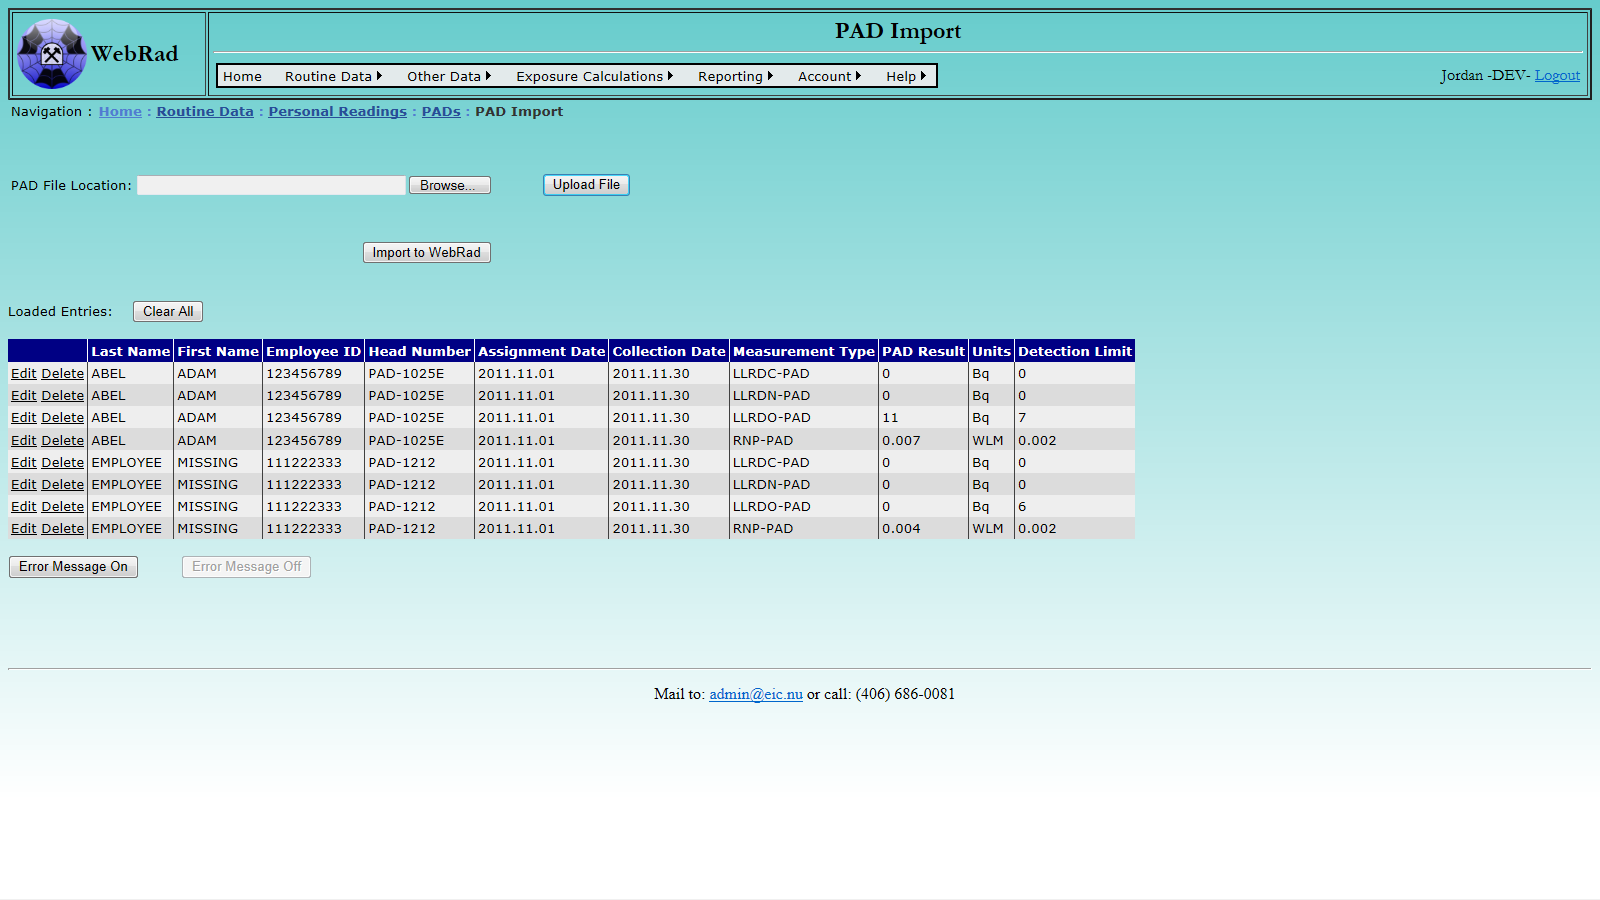
Once you have a set of values uploaded into the temporary table Click on the "Error Message On" button. This will evaluate the records and see if they can be matched to existing active PAD's for all of the employees associated to the PAD's. If no messages are shown, Click the "Import to WebRad" button to import the records into the system. If error messages were not initially checked before importing a record, for example, the PAD could not be matched to one in the system or perhaps their are no longer people attached to that PAD by a transaction, the record will not be imported. It will then remain in the temporary table while successful records will be removed from the table and their associated PAD's will be set to inactive. The data table containing error messages can be turned on and off by clicking the buttons "Error Message On" and "Error Message Off" respectively. Once done importing PAD's its good practise to remove any loaded/remaining records by clicking the "Clear All" button, or else they will stay there until a successful import is accomplished.
Note that if PAD's are activated by the bulk personal equipment page, results may be uploaded again, then edited to have thier values modified. These can then be imported once more and they will simply overwrite previous values for those PAD's.
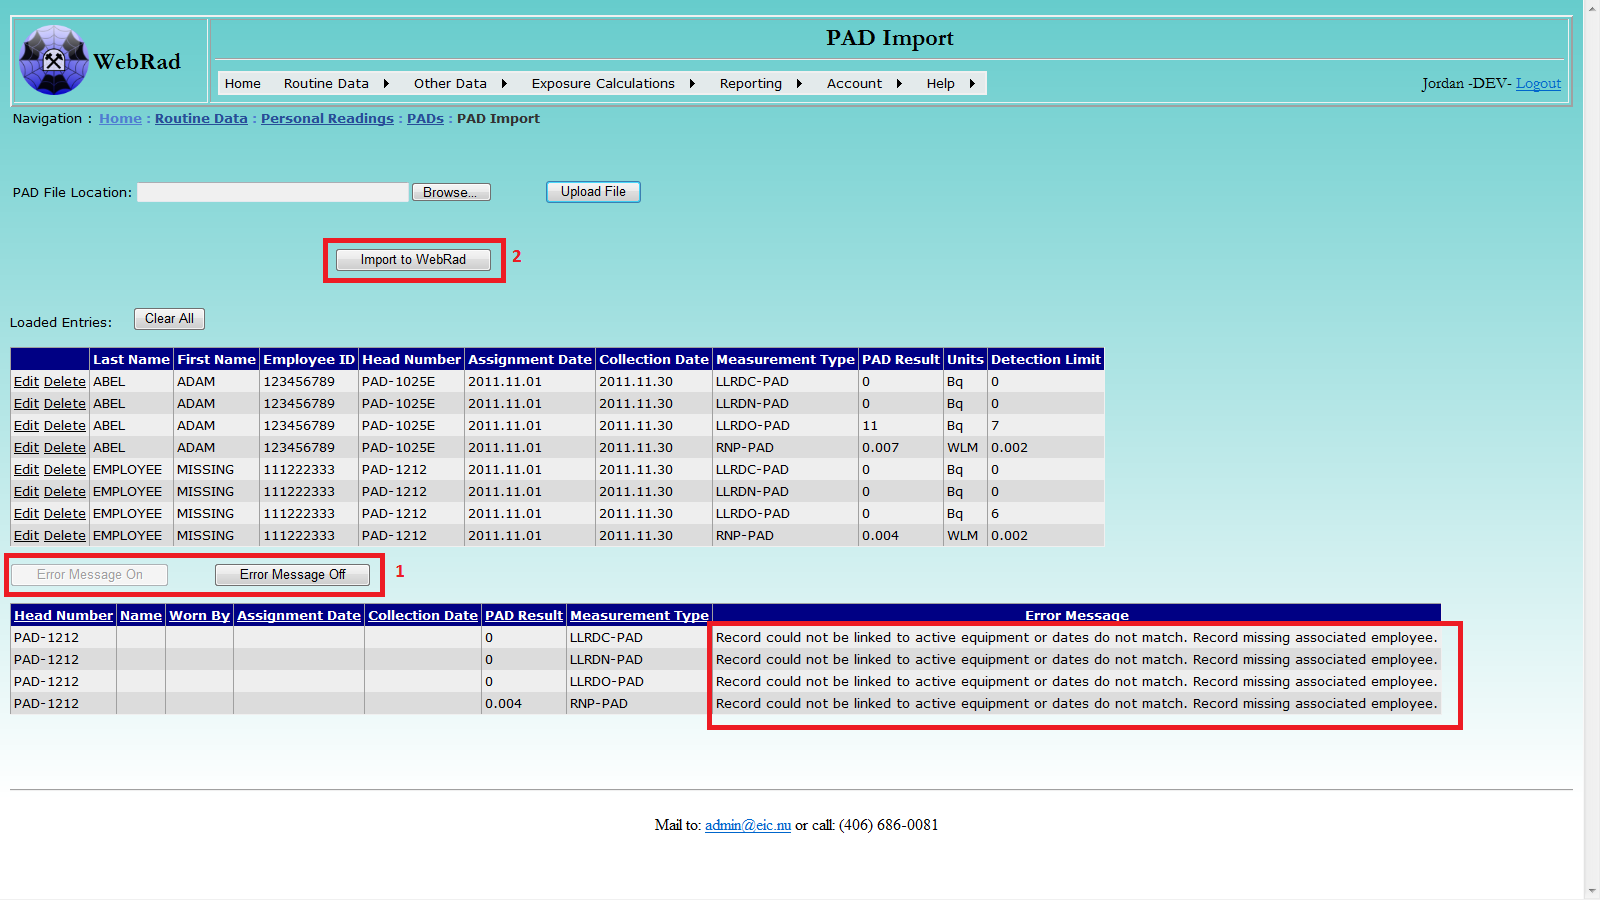
9.8 Radiation Work Permits
Radiation Work Permits are used to log exposures for workers completing tasks having the potential to contribute significant radiation doses. Generally a supervisor will assess an area by taking area readings, predict a maximum time for the task, and then send out workers to complete the task. Workers may or may not carry with them personal dosimeters to record their exposure levels. So a combination of area time occupancy and dosimeter results are used to generate an acceptable exposure to be assigned to each worker.
Mouse over "Routine Data" on the menu bar, go down to "Personal Readings", go over and click on the "Radiation Work Permit" link. To add more employees to an 'Active' work permit select it from the drop down list and proceed to the description below.
To generate a new permit follow these two steps:
Step 1: Leave the selected permit set to '-- Create New --'. Enter the permit's name, noting that this field is not allowed to be blank. Make sure the permit is set to 'Active'. Inactive permits will not show up in drop down lists. Next select the 'Year' and associated 'Time Frame' for the permit. These selections are just for book keeping purposes. Select a respirator to be used with the permit. A description of the respirator methodology is given below in the description for adding employees to the work permit in step 2. Select the permit start and end date. This is the range of days that the permit results will be spanned when it comes time to do exposure calculations. Therefore, when entering employee 'Actual Hours' in the second part of the permit, you should enter the total number of hours the employee worked for the date range of the permit. Fill in the remaining descriptive data. The 'Predicted Hours' is just a number used to log how long you think the job will take. It is not used in calculations. The permit type is a selection of 'Long Stay' and 'Short Stay' which is used to define permits of significant durations or quick jobs. This also is used in reporting as a selectable filter. Finally fill in the area readings that will be used if no dosimeters are to be worn. These values will be used, along with exposure conversion factors and repirator credits to generate time occupancy estimates. If you are satisfied with all of the data entered, select 'Create Permit'. The page will reload with a bulk screen below for adding employees (This is described in step 2 below). You will notice that the permit entry screen is now set to inactive. If you wish to modify the original permit data you must delete the permit and start again. If the permit is acceptable, proceed to step 2.
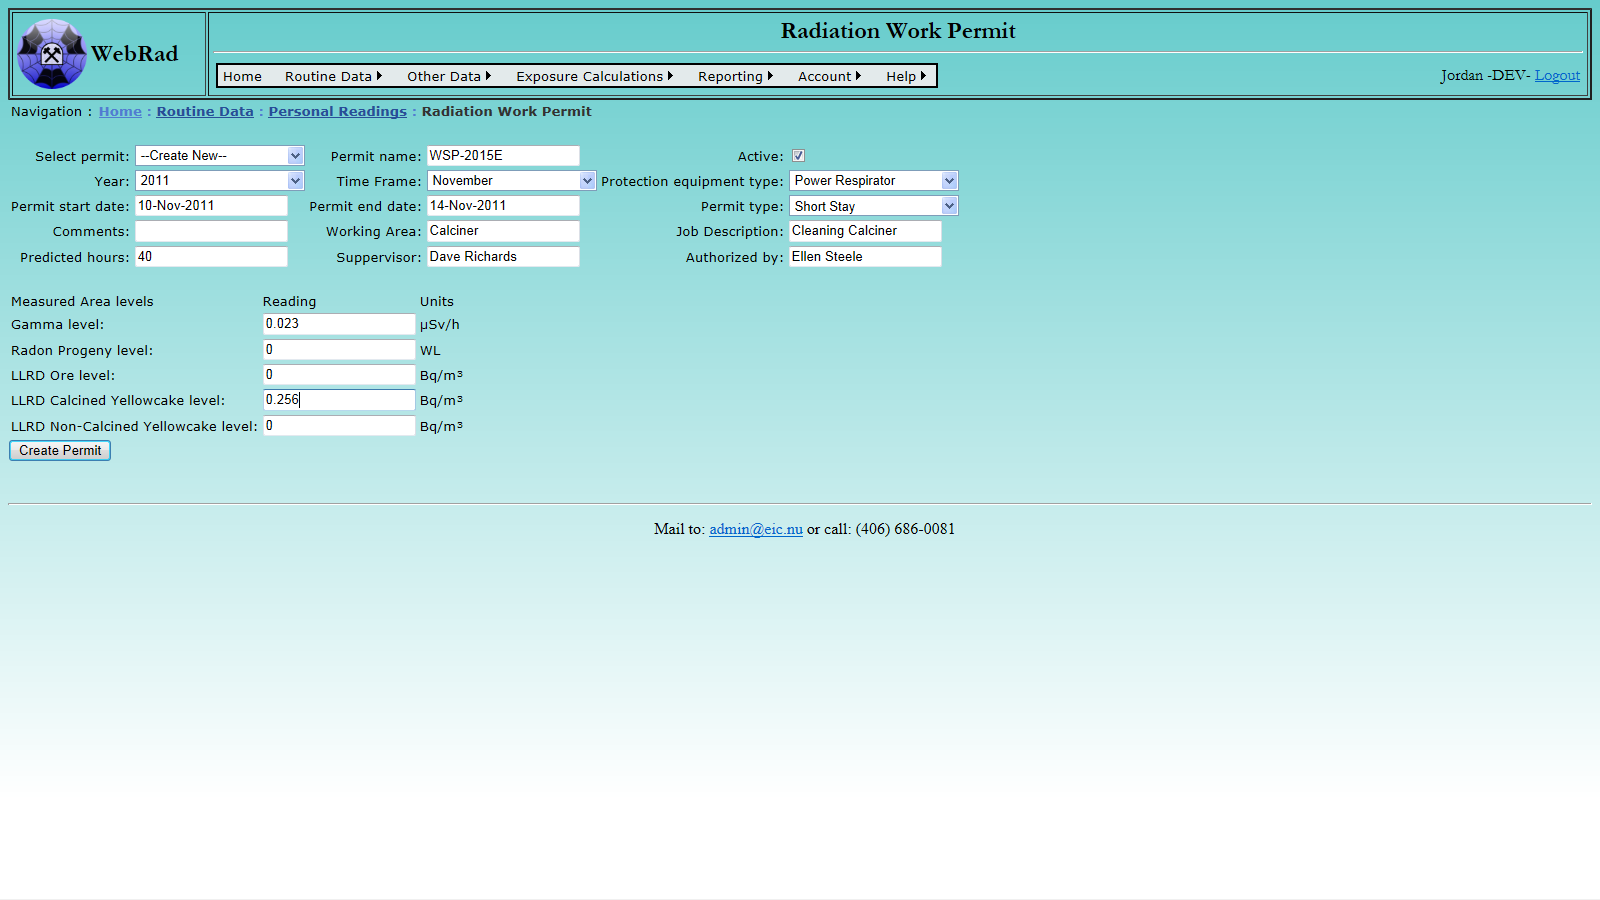
Step 2: Once the permit is created you can begin to assign workers to it. Using the bulk rows below, select an employee from the drop down list. In the 'Actual Hours' column, type in the number of hours that the employee has worked for the entire span of the permit. As soon as you tab out of that field, WebRad will automatically generate exposures for each of the contaminants based on the area readings entered above and the amount of 'Actual Hours' for which the employee has worked. Note that these values are calculated using an exposure conversion factor, which can be found in the Contaminants table under the appropriate area contaminant. Also, if a respirator is used and it has a protection factor associated to it for one of the contaminants, and it is valid for the date range of the work permit, its protection factor will be used in generating the exposures. Any results which make use of a respirator credit are set to be used, regardless of rank, in generating an employees dose which running exposure calculations. If you wish to override the calculated estimate with actual dosimeter results, simply enter the dosimeter result directly into the field.
Any additional comments about the worker's time spent on the permit can be entered in the comments field to the right. Multiple workers can be assigned to a permit but each worker can only have one entry per permit. Once all workers are added, click on the 'Commit Readings' button below to save the records to the database. If not already visible, a grid view will be displayed with the associated employees and exposures.
If you make a mistake and have remove an employee, simply click on the 'Delete' button in the grid view to remove that employee from the permit. Alternatively, you may select the 'Delete Permit' button to delete the entire permit and associated employee records to start over.
Upon completion of a work permit it is a good idea to post the data right away. Mouse over "Exposure Calculations" on the menu bar, go down to "Posting", go over and click on the "Post Personal Readings" link. Search for each of the Radiation Work Permit type methods and select a date range that containts the permit date. Post the results for each employee attached to the permit. Go back to the Radiation Work Permit screen and select your permit from the drop down list at the top. You will notice that the 'Delete Permit' button has been deactivated. This is because the permit now has posted readings to it. Each individual will also have a deactivated delete associated to them if all of their work permit values are posted.
You will notice over time that as you create more and more permits, the drop down select permit list will begin to get fairly large. As a maintenance procedure, it is a good idea to 'Deactivate' permits that have had all data finalized. To do this, Mouse over "Other Data" on the menu bar, go down to "Personal Readings", go over and click on the "Personal Readings Equipment" link. In the grid view at the bottom, select the Equipment Name column title. This will sort the grid view by the equipment name. Search through the records until you find your permit. Once you have found it, edit the record and set its 'Active' status to 'inactive' and then select 'Update'. Your permit should no longer show up in the drop down list at the top of the Radiation Work Permit page.
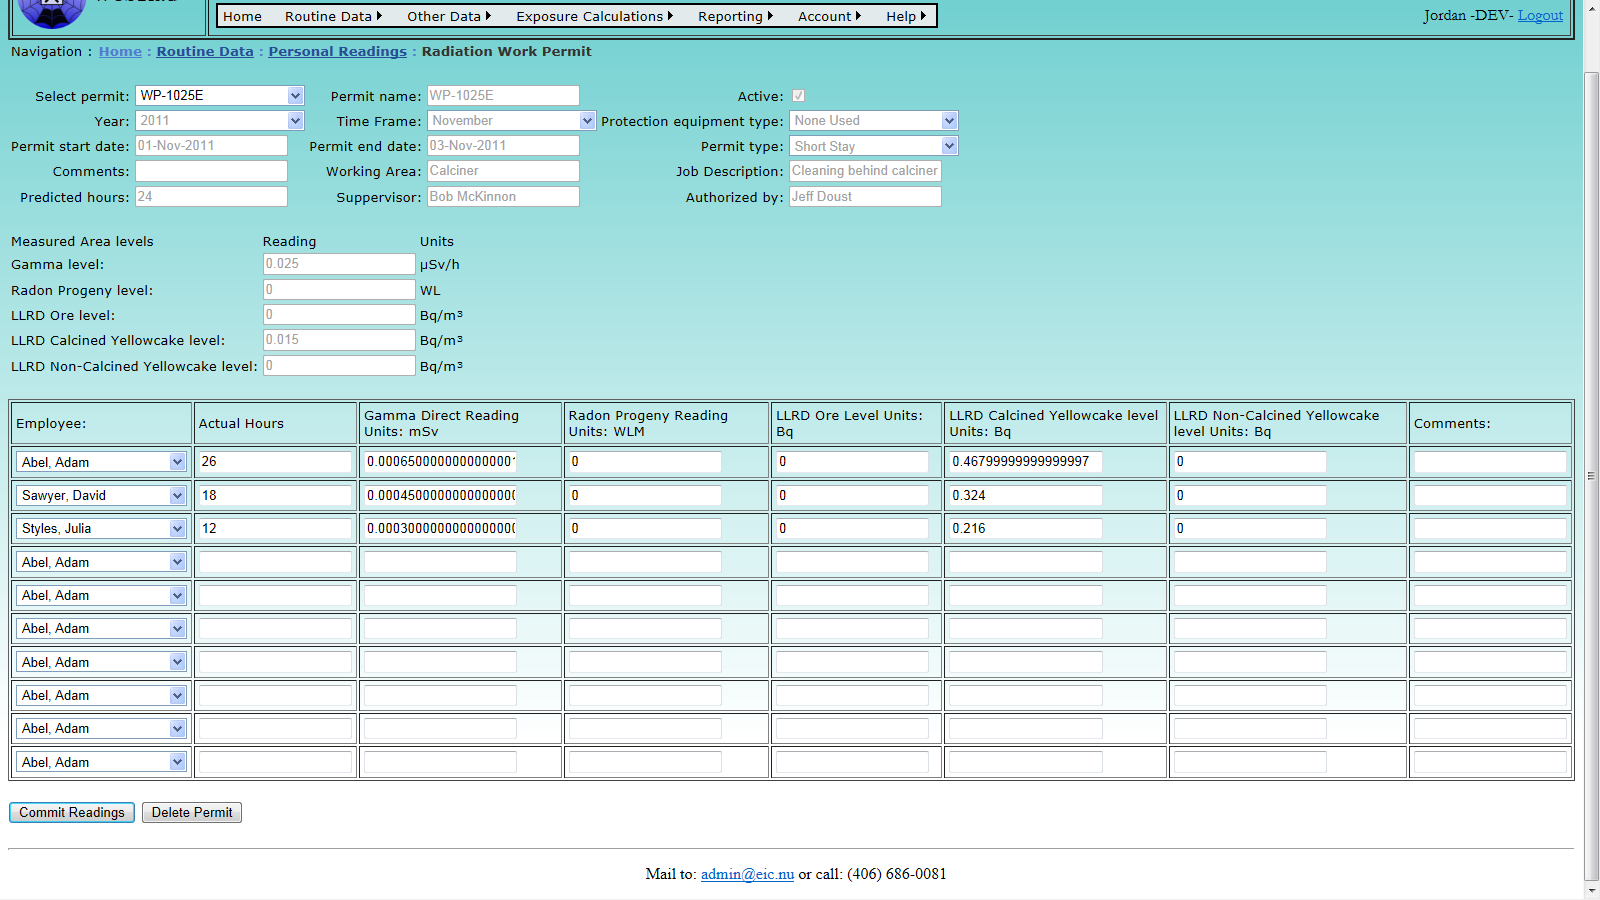
10. Exposures
10.1 Exposures Overview
Exposures are stored in WebRad in a monthly table, however they are initially analyzed with a daily resolution.
Exposure values are calculated from a combination of time spent in dosimetry areas and measurements recorded as personal readings. On any given day, their can be multiple ways to obtain an exposure for a particular dose component. These different pathways are what WebRad denotes as "Contaminants". As an example, the dose component Radon Progeny would have "Contaminants" that include "Radon Progeny - Area", "Radon Progeny - PAD", "Radon Progeny - Radiation Work Permit", etc. Each of these contaminants has an associated integer ranking value assigned to it. The lower the integer value, the higher the priority the "Contaminant" has.
All calculations take place on a daily level where records from personal readings (broken into equal daily values for the span of the personal reading) and dosimetry area time calculations are selected based on the ranking value of their associated "Contaminant". The lowest ranked record for the day is selected. Multiple records of equal rank may exist on any particular day. In addition to this, if a personal reading or time card was created with an additive identifier set, it will be included in that day's value regardless of its associated rank. The additive identifier is generally used so area time values can be generated and included on days where a worker has removed their primary measuring device but still needs to be assigned it's entire measured value (Generally the case when workers remove their PAD to go under a respirator).
10.1.1 Exposures Due To Personal Readings
Personal readings are used to log exposure values that span the range of one or more days. These measured values, often coming from things such as TLDs, OLDs, PADs, etc, are divided up daily over the range of the measuring device. The rank for the daily value is determined from the "Contaminant" that record is connected to.
10.1.2 Exposures Due To Time Spent In Dosimetry Areas
At this stage, contaminant concentration levels are calculated for each dosimetry area based on the weighted average of readings taken from the dosimetry area's member locations. Only readings of valid "Sample Types" and readings at locations which are current under the dosimetry area are used. Averages are then done on a daily, weekly, monthly, quarterly, or yearly basis. This averaging is dictated by the dosimetry area's associated "Time Grid" value. Once an average value is calculated it is inserted for every day of the given period.
Time cards, which are already on a daily basis, are mapped to their corresponding dose areas and exposures values are obtained for all of the contaminants linked to the dosimetry area by its "Scheme". If a time card indicates the use of a valid respirator, a protection factor is brought into the calculation and that records additive identifier is set.
10.2 Setting Up Dose Components
Dose Components are the groups of Contaminants which are used to record employee dose. Generally these should be left to the defaults of Gamma, Radon Progeny, LLRD Ore, LLRD Calcined Yellowcake, and LLRD Non-Calcined Yellowcake. Additional Dose Components may be created, and if they are linked to a Contaminant that can be associated to an employee either through Personal Readings or time spent in dose areas, then doses will be calculated and stored in the monthly table when dose calculations are ran.
Mouse over "Other Data" on the menu bar, go down to "Contaminants", go over and click on the "Dose Components" link. Type in the name of the new Dose Component you wish to create. Select an appropriate NDR Dose Type if required. These are used by the NDR export to find relevant employee doses to export in the Quarterly NDR file. Enter the Dose unit and Exposure unit. Note these should reflect the units of the "Dose Conversion Factors" and "Exposure Conversion Factors" or the Contaminants that will be assigned to this Dose Component. Enter any comments required and make sure that the "Active" check box is selected, then click on the "Add Dose Component" button.
Note that editing the name of the default dose components or changing the NDR Dose Type may cause some parts of WebRad to not work properly. It is suggested that the default values not be modified.
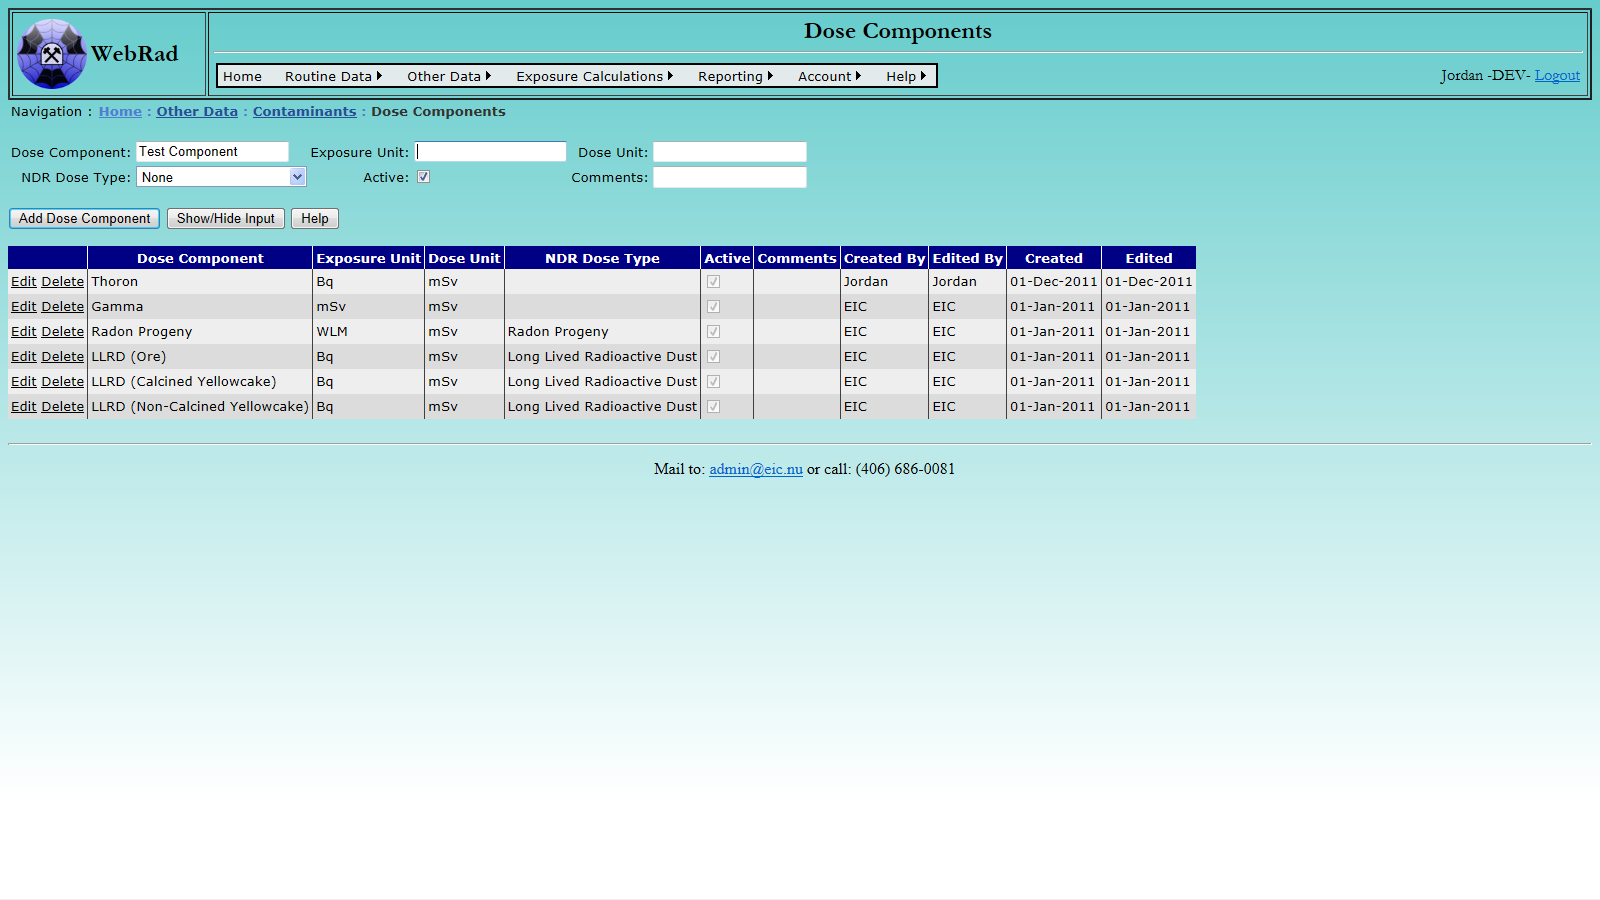
10.3 Calculating Monthly Exposures
Mouse over "Exposure Calculations" on the menu bar, go down and click on the "Calculate Monthly Personal Exposures" link. Choose a month and a year from the drop down list and then click the "Calculate" Button. The exposures procedure will complete when the grid view below is populated with monthly exposures.
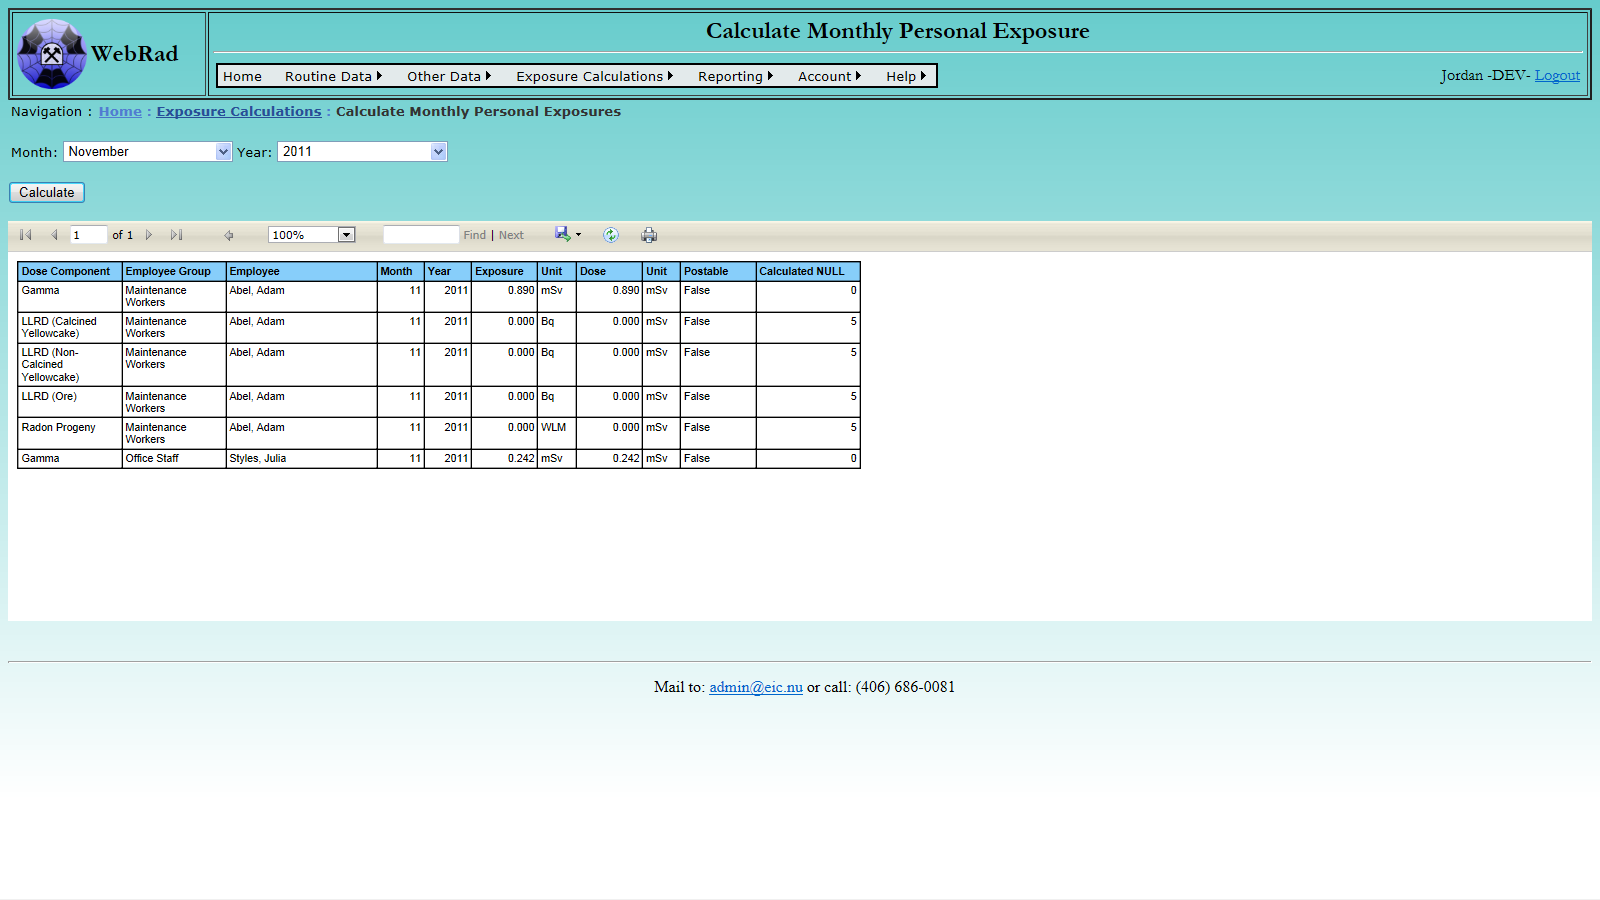
10.4 Viewing Calculated Exposures
As was stated earlier, WebRad stores exposures on a monthly basis. Therefore monthly exposures may be viewed directly as they sit in the table. Viewing the quarterly exposures is simply a sum of the monthly exposures table for a given quarter. Daily exposures on the other hand are not stored in WebRad and hence must be calculated on the fly each time they are to be viewed. The idea with the daily exposures view is that it is to be used as a diagnostic tool to determine how WebRad goes about calculating exposures for given individuals over a specific date range. When monthly exposures are being calculated, WebRad looks at this daily view and sums the results for a specific month and then inserts those monthly values into a table of stored exposure values which most reports are then ran off of.
10.4.1 Viewing Daily Calculated Exposures
Mouse over "Exposure Calculations" on the menu bar, go down and click on the "View Daily Personal Exposures" link. Daily personal exposures may be viewed for one or many employees. When selecting an individual employee, leave all of the other selection criteria set to "All", except for the Dose Component selection unless you wish to view all Dose Components. By default, inactive employees are not included in the drop down box. You may add them to the drop down box by checking the "Display Inactive" box beside the Employee selection box. If you wish to view several employees using the filtering criteria, make sure you leave the Employee selection set at "All".
Select all of the desired filtering critera required. Pick an appropriate Start and End date to view the exposures for and click the "Calculate" button to display the results. When an employee has dose assigned from a dosimetry area, it will be noted in the grid view along with the amount of hours they spent in that area. When an employee gets their dose from a personal reading it will indicate the name of the personal reading and the dosimetry area and hours will be set to "N/A". The "Calculated Null" column indicates that an employee assigned thier time to a dosimetry area for which the given contaminant was not found in and so was assigned a zero.
Note that the filtering criteria is based on the employees "Current Entry" status in the employee history table.
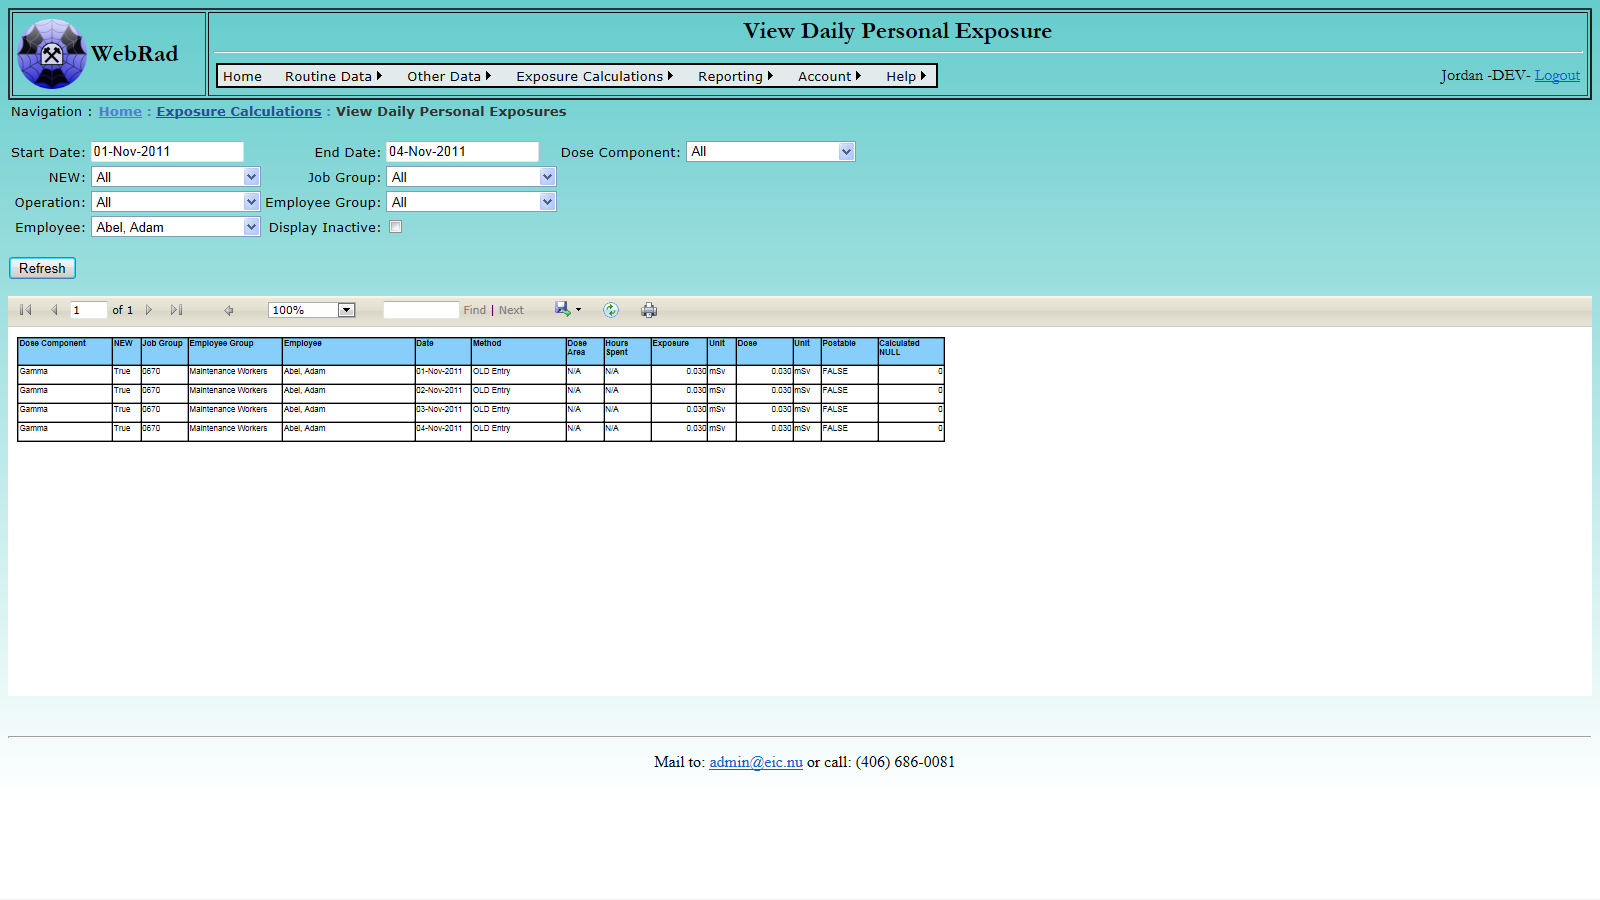
10.4.2 Viewing Monthly Calculated Exposures
Mouse over "Exposure Calculations" on the menu bar, go down and click on the "View Monthly Personal Exposures" link. This page is used to review the existing calculated monthly personal exposures in the database. Select a Year and Month from the drop down lists. The grid view below will automatically update each time any of the filtering critera is modified.
Note that the filtering criteria is based on the employees "Current Entry" status in the employee history table.
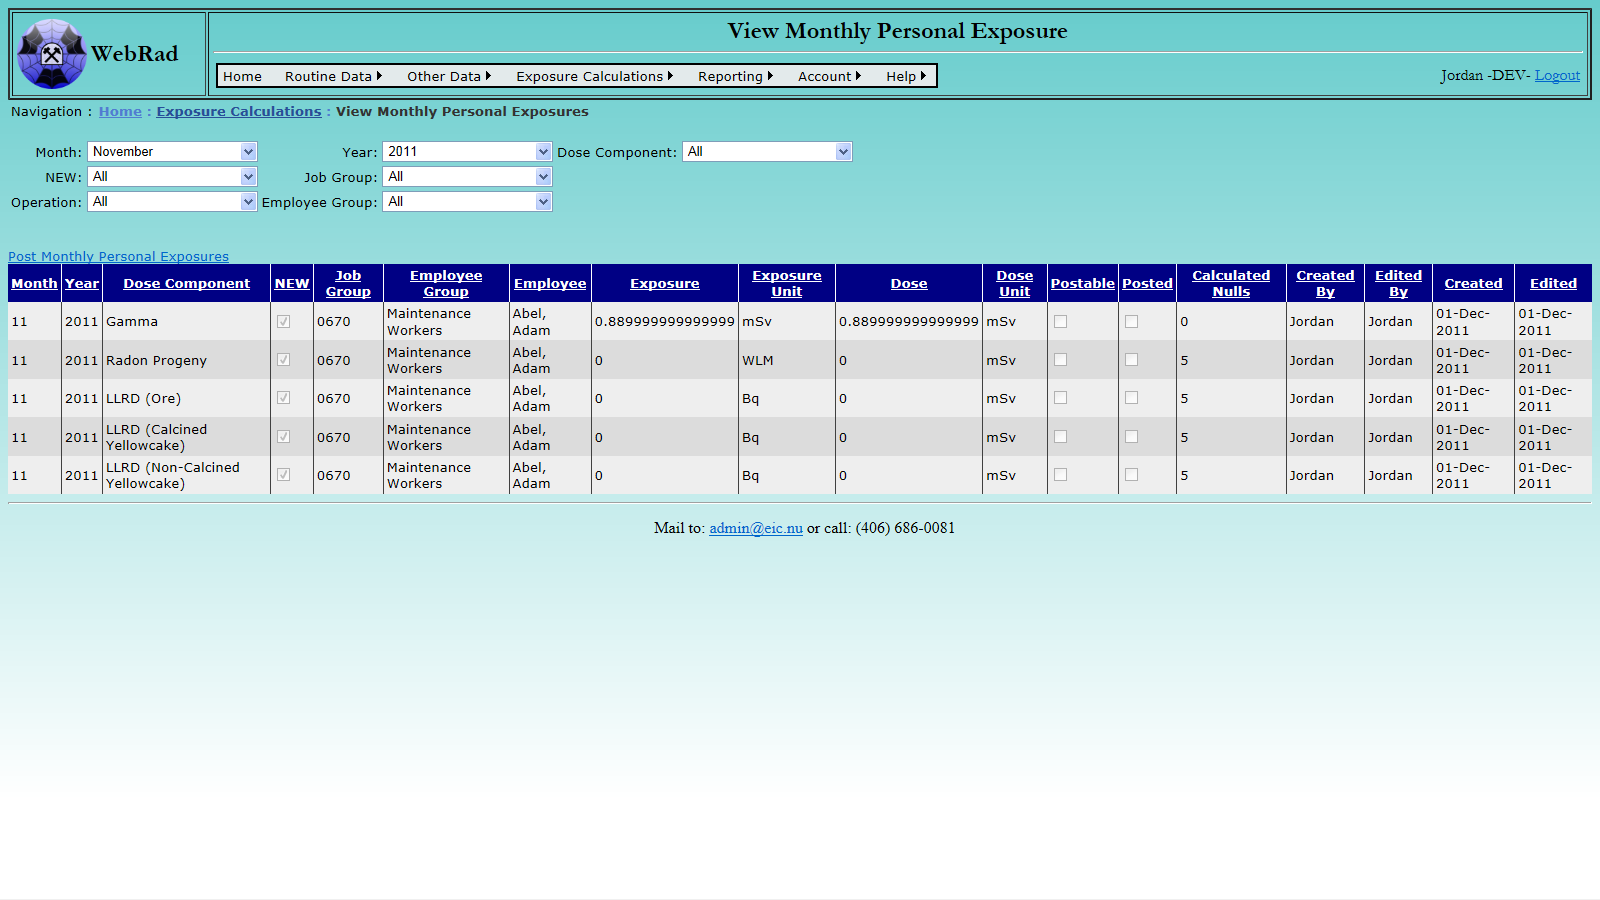
10.4.3 Viewing Quarterly Calculated Exposures
Mouse over "Exposure Calculations" on the menu bar, go down and click on the "View Quarterly Personal Exposures" link. This page is used to review the existing calculated monthly personal exposures in the database on a quarterly basis. Like the "View Monthly Calculated Exposures" page, it populates the grid view dynamically based on the selection in the filtering criteria. In order for a quarters worth of data to be correctly represented, all of the months in that quarter must already have their exposures calculated and stored.
Note that the filtering criteria is based on the employees "Current Entry" status in the employee history table.
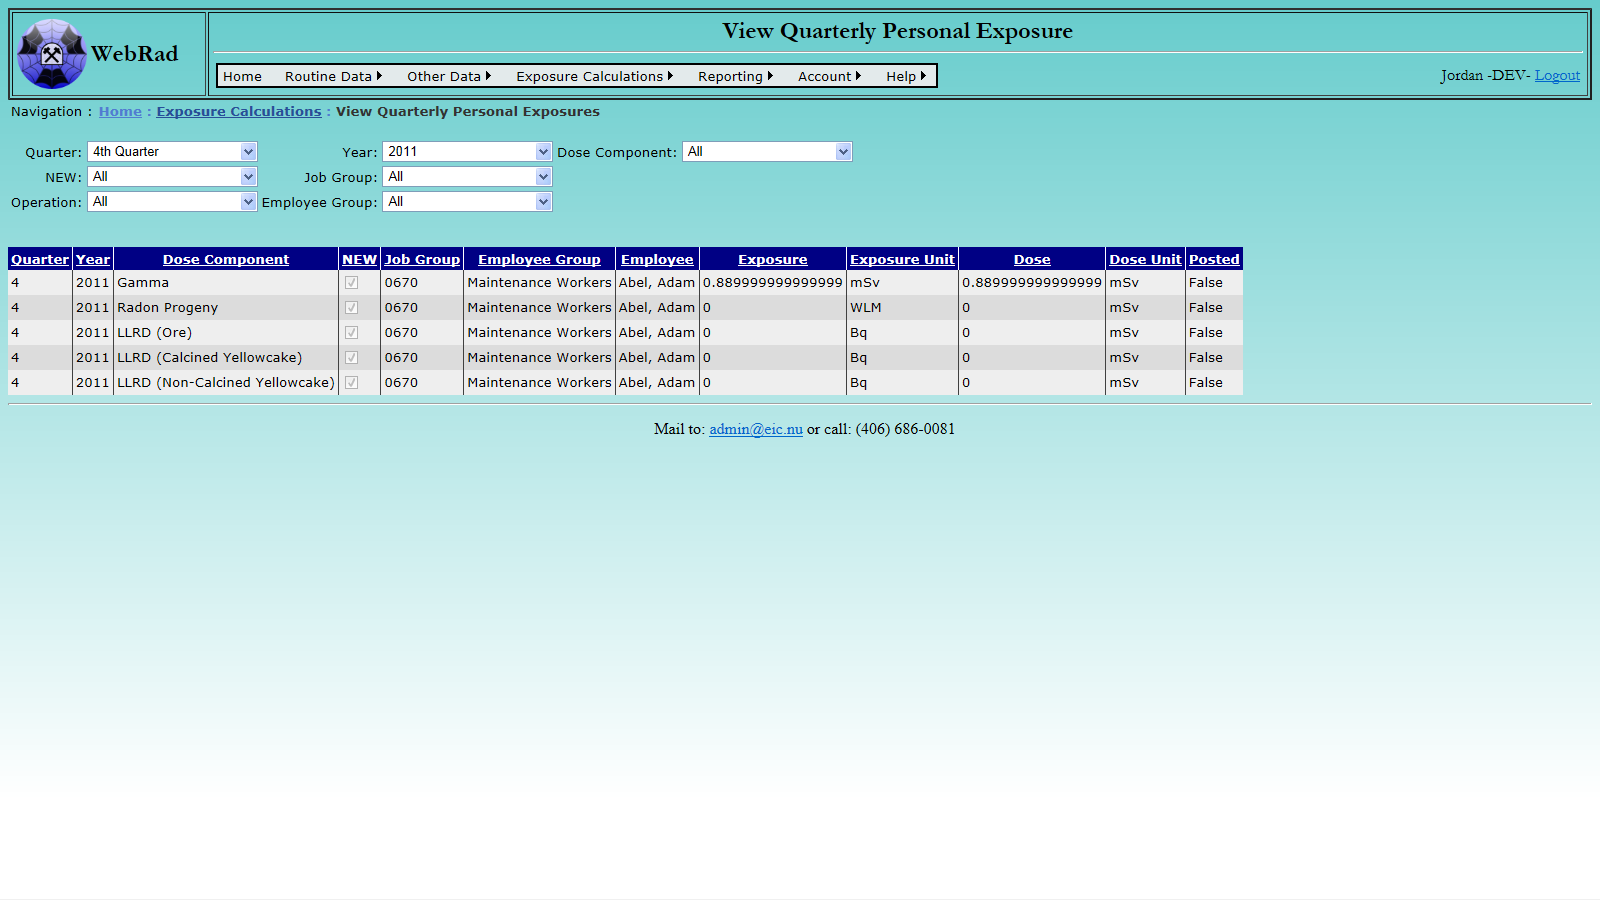
11. Posting
11.1 Posting Overview
The concept behind posting is that once data is posted it is finalized. At this point, the data can only be changed or deleted if it is unposted first, although this should be avoided. If there is data in subsequent tables that were calculated from this value, then it is up to the user to redo these calculations to reflect the change (for example, if a contaminant reading was edited, then the exposures for that month would need to be recalculated). Generating a postable exposure requires all worker time data, worker personal readings, and location readings used to create the exposure to be posted.
11.2 Posting Data and Final Exposure Calculations
Before performing final exposure calculations, all of the data that the calculations are based on must be posted. The reason for this is that WebRad keeps track of whether exposure data is based only on posted data or not. In order to post exposure data, first all data used to create a given exposure must be posted. You can tell if exposure data can be posted based on the status of the "Postable" column. Raw readings data, on the other hand, can always be posted.
The first step is to post all of the readings data for the area contaminants.
11.2.1 Post Contaminant Concentration Readings
Mouse over "Exposure Calculations" on the menu bar, go down to "Posting", go over and click on the "Post Readings" link. Choose a sampling date range and then a contaminant from the drop down list. The grid view will refresh with each selection. Individual readings can be posted by checking the "Post/Unpost" check box next to them and then clicking "Comfirm Post/Unpost Selections". Alternatively, all displayed readings can be posted at once by clicking the "Post All" button.
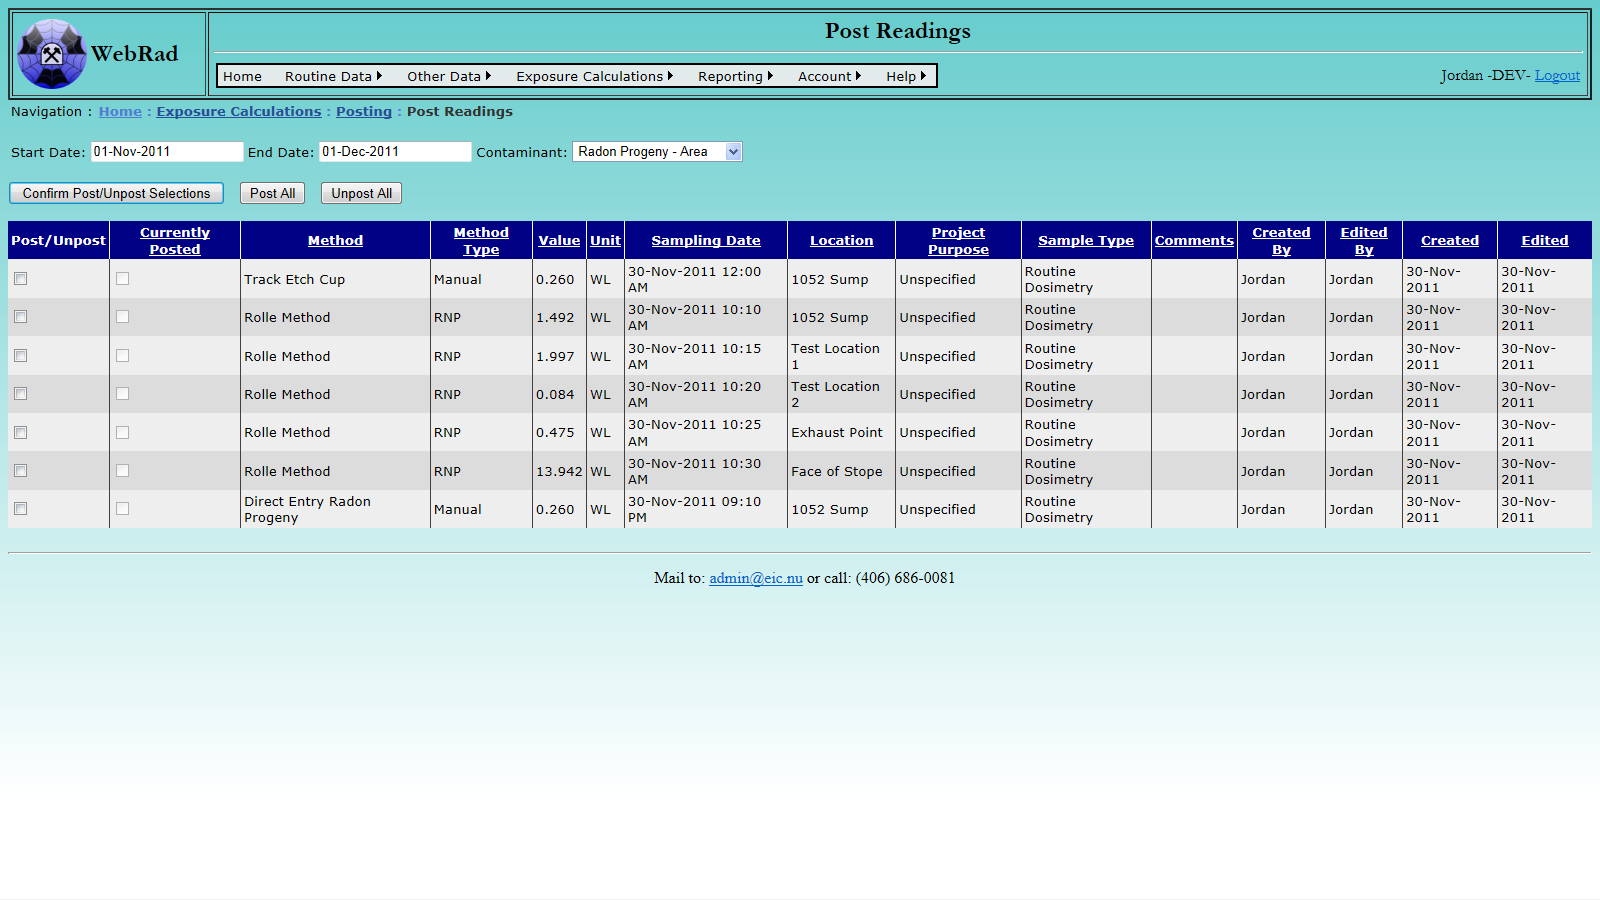
11.2.2 Post Personal Readings
Mouse over "Exposure Calculations" on the menu bar, go down to "Posting", go over and click on the "Post Personal" link. Choose a range of dates that correspond to the Personal Reading ending dates, then choose the Personal Method for which readings are to be posted. Not that historic migrated readings that have no use in exposure calculations have no need to be posted but their method will still appear in the drop down list. The grid view below will populate with all Personal Readings which exist between the date ranges specified. Individual reading entries can be posted by checking the "Post/Unpost" check box next to them and then clicking "Comfirm Post/Unpost Selections". Alternatively, all displayed reading entries can be posted at once by clicking the "Post All" button.
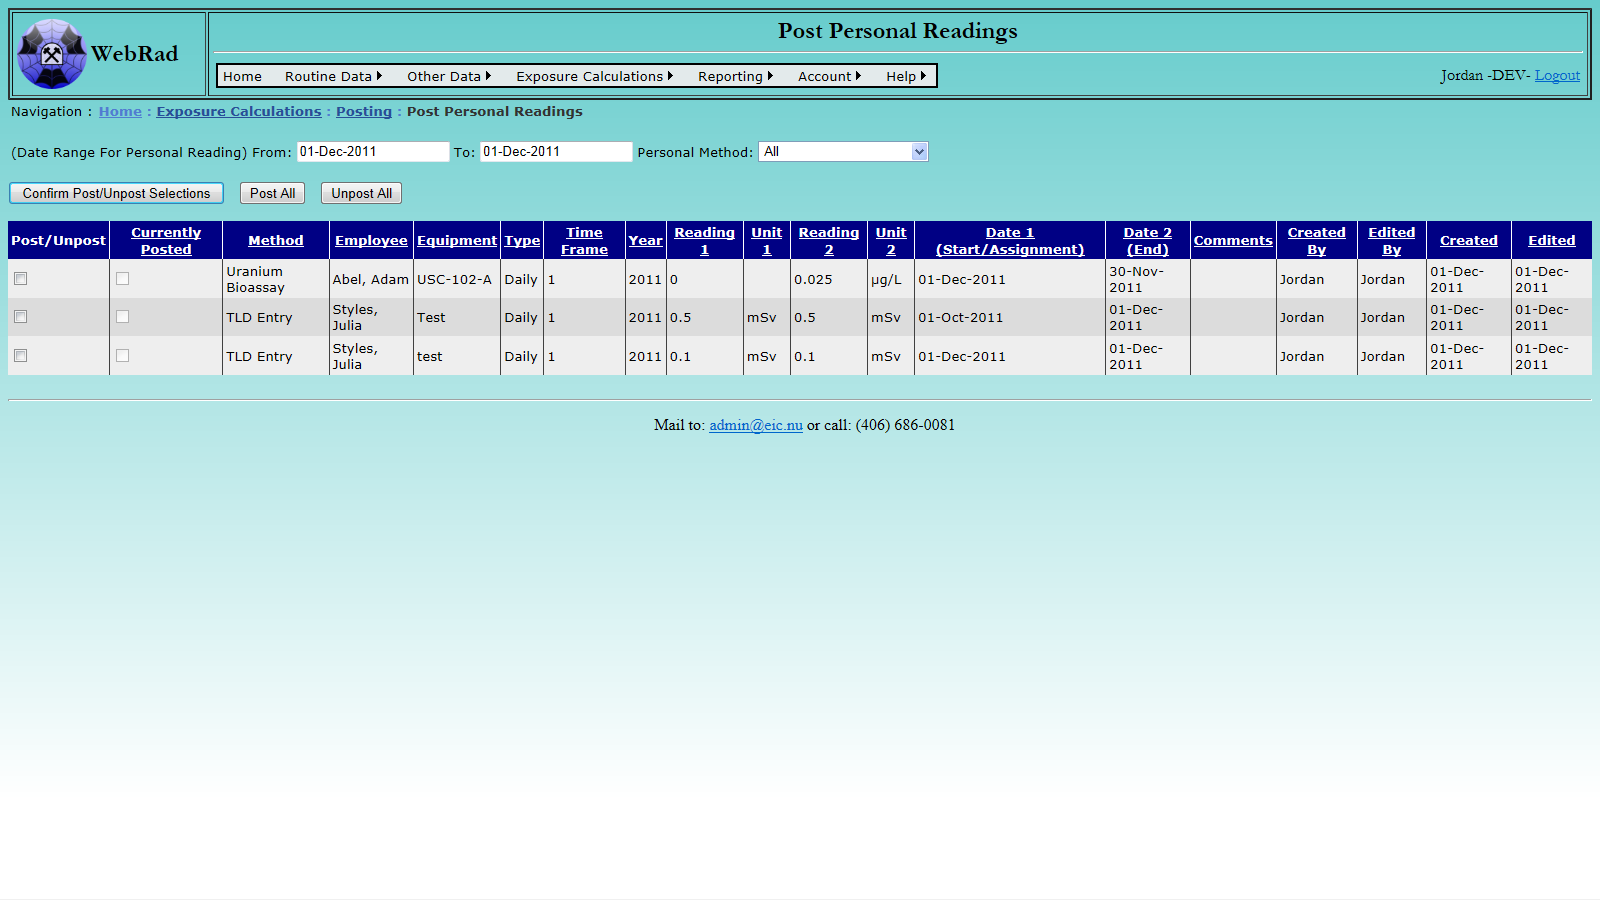
11.2.3 Post Time Cards
Mouse over "Exposure Calculations" on the menu bar, go down to "Posting", go over and click on the "Post Time Cards" link. Choose start date and the end date for the range of time cards. The grid view below will populate with all worker time cards for that period. Alternatively, you can select an employee from the drop down box to obtain only their time cards for that period. Individual time card entries can be posted by checking the "Post/Unpost" check box next to them and then clicking "Comfirm Post/Unpost Selections". Alternatively, all displayed time card entries can be posted at once by clicking the "Post All" button.
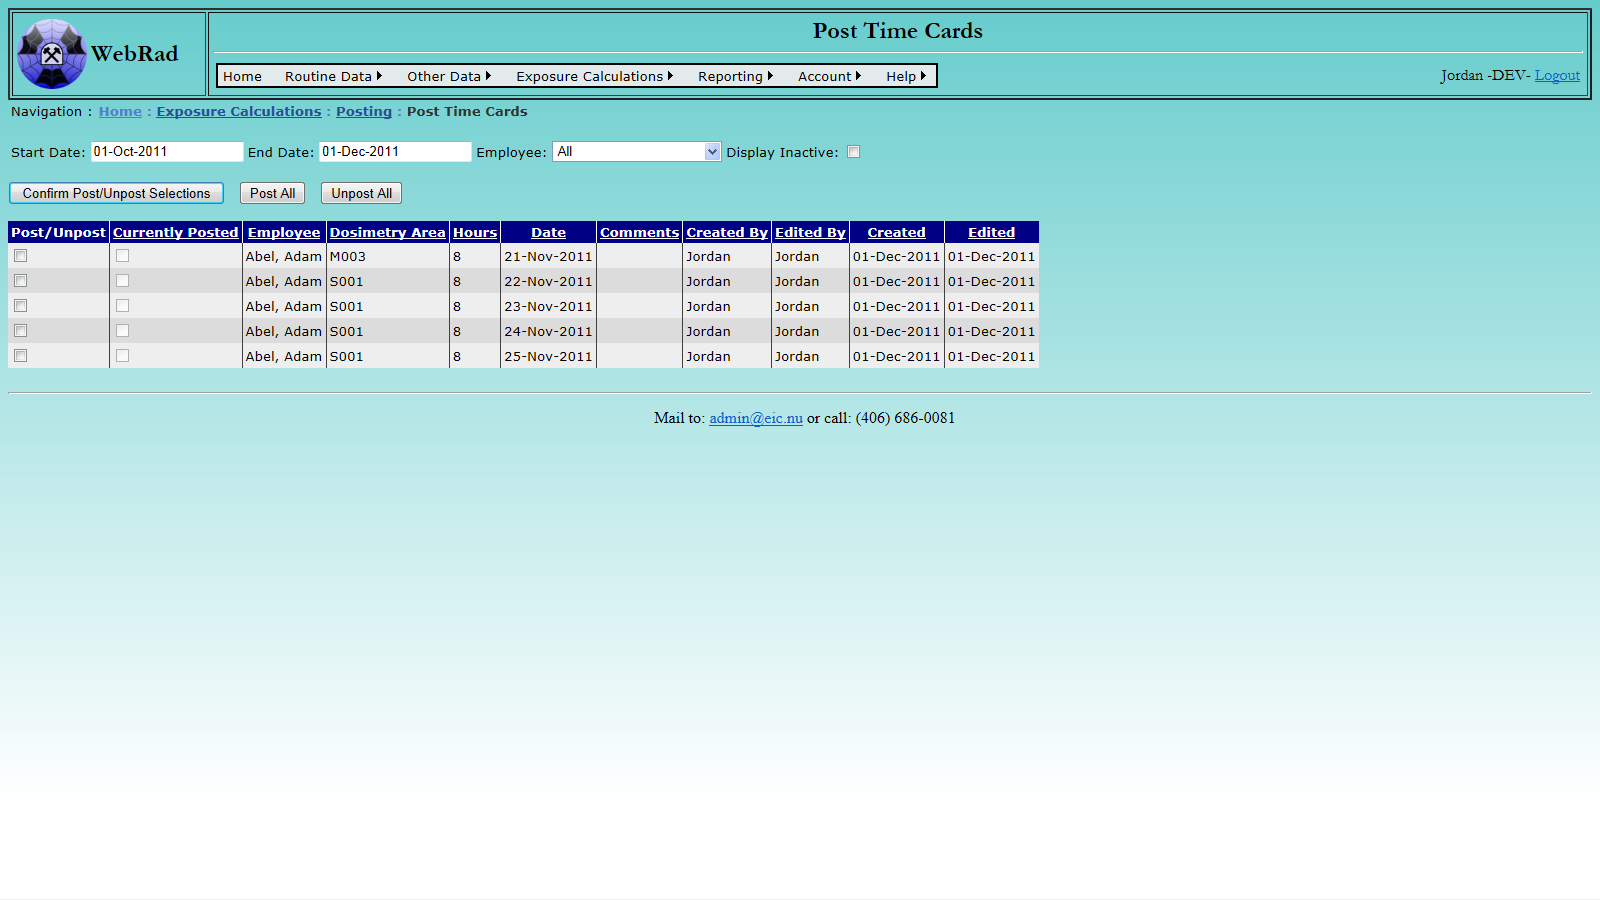
11.2.4 Calculate Monthly Personal Exposures
See section 10.3
11.2.5 Post Monthly Personal Exposures
Once the monthly personal exposures have been calculated, their "Postable" field should indicate that they are now postable. Mouse over "Exposure Calculations" on the menu bar, go down to "Posting", go over and click on the "Post Monthly Personal Exposures" link. Choose the month, year, dose component, and employee group from the drop down lists. Individual readings can be posted by checking the "Post/Unpost" check box next to them and then clicking "Comfirm Post/Unpost Selections". Alternatively, all displayed readings can be posted at once by clicking the "Post All" button. Note that if a reading has a value of 'false' in its "Postable" column, then it was created using unposted data. In order to post that reading, the unposted data used to create it will have to be found and posted.
Note: Dosimetry area readings can be created by looking back at prior area readings. If it seems like all of the data has been posted for the given month, yet the employee exposure record is still not postable, it could be that that employee logged their time to a dosimetry area that is looking back at previous months area readings which may be unposted.
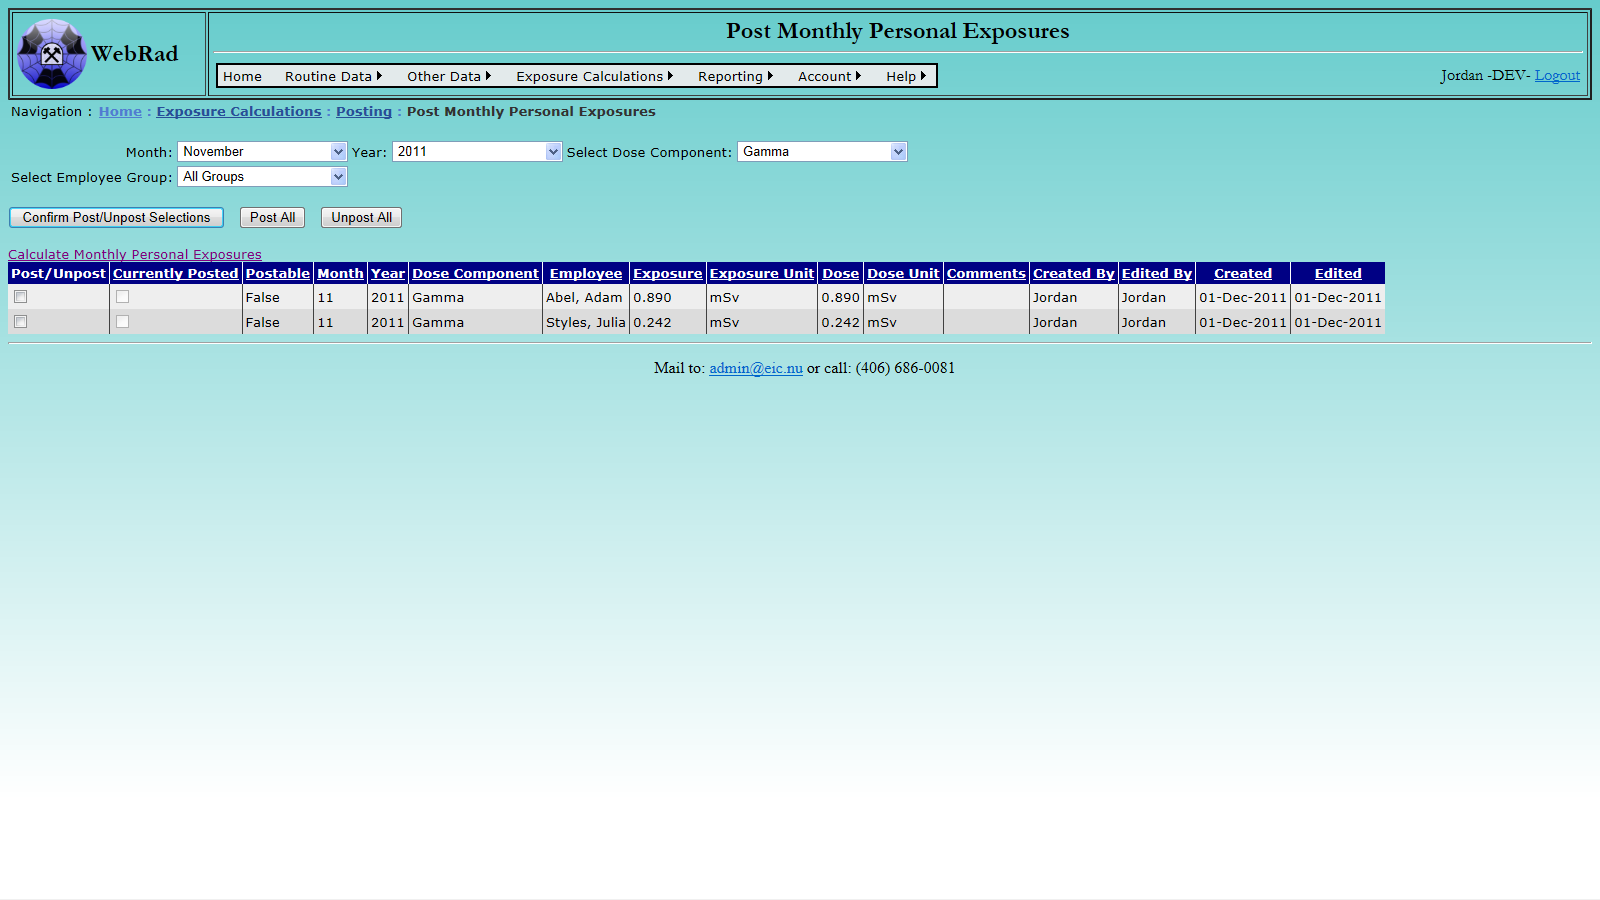
12. Reports
12.1 Area Monitoring Reports
These reports are used to report on the location and area contaminant levels.
12.1.1 Area Monitoring Distribution Report
To get to the report mouse over "Reports" on the menu bar, go down to "Area Monitoring Reports" then go over and click on the "Area Monitoring Distribution Report" link. This report is used to show the frequency of contaminant readings for specific areas.
First select whether you want to report off of WebRad's dosimetry areas or the physical sampling areas. Next, select the Operation for which the report is to be ran. If reporting on physical areas, a select site drop down box will appear which will further filter the areas. If dosimetry areas area selected as the reporting type, you can proceed to select an area. Multiple areas can be selected by holding the "Ctrl" key on the keyboard and clicking the individual areas with the mouse. This can also be used to select multiple "Sample Types". Select the "Contaminant" which is to be reported on and pick the appropriate reporting "Start" and "End" dates. When choosing a date range the start date time will be set to 00:00:00 and the end date time will be set to 23:59:59. Click the "Refresh" button to get the report to display. If any data was incorrectly entered an error will appear beside the "Refresh" button indicated what has stopped the report from being generated.
Note: By default, the report will place negative readings in the lowest category.
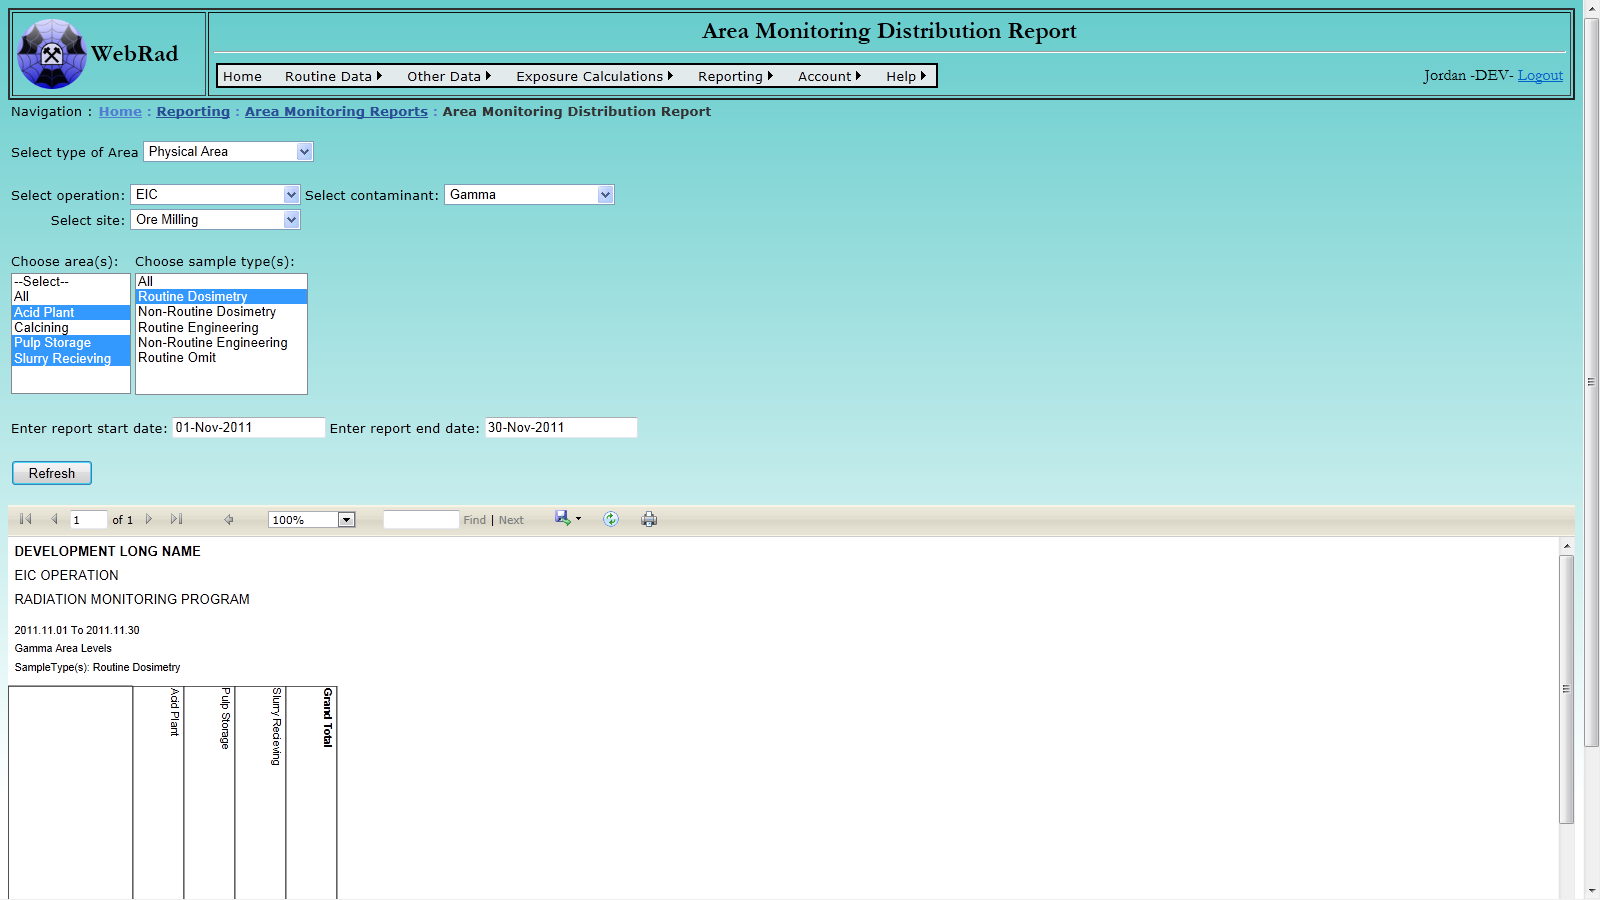
12.1.2 Area Monitoring Summary Report
To get to the report mouse over "Reports" on the menu bar, go down to "Area Monitoring Reports" then go over and click on the "Area Monitoring Summary Report" link. This report is used to show the total readings at individual locations for a given period of time. The "Total" value is an aggregate value which can be any one of the following functions: Sum, Minimum Value, Maximum Value, Average Value, Standard Deviation, or Variance. This total is also shown for each area in the report.
First select whether you want to report off of WebRad's dosimetry areas or the physical sampling areas. Next, select the Operation for which the report is to be ran. Next select the "Sample Types" to be used. Multiple sample types can be selected by holding the "Ctrl" key on the keyboard and clicking the individual sample types with the mouse. Select the aggregate function required and pick the appropriate reporting "Start" and "End" dates. When choosing a date range the start date time will be set to 00:00:00 and the end date time will be set to 23:59:59. Click the "Refresh" button to get the report to display. If any data was incorrectly entered an error will appear beside the "Refresh" button indicated what has stopped the report from being generated.
Note: The report is set up to report only on area readings for the following Contaminants: Radon Progeny, Gamma, LLRD (Ore, Calcined Yellowcake, Non-Calcined Yellowcake).
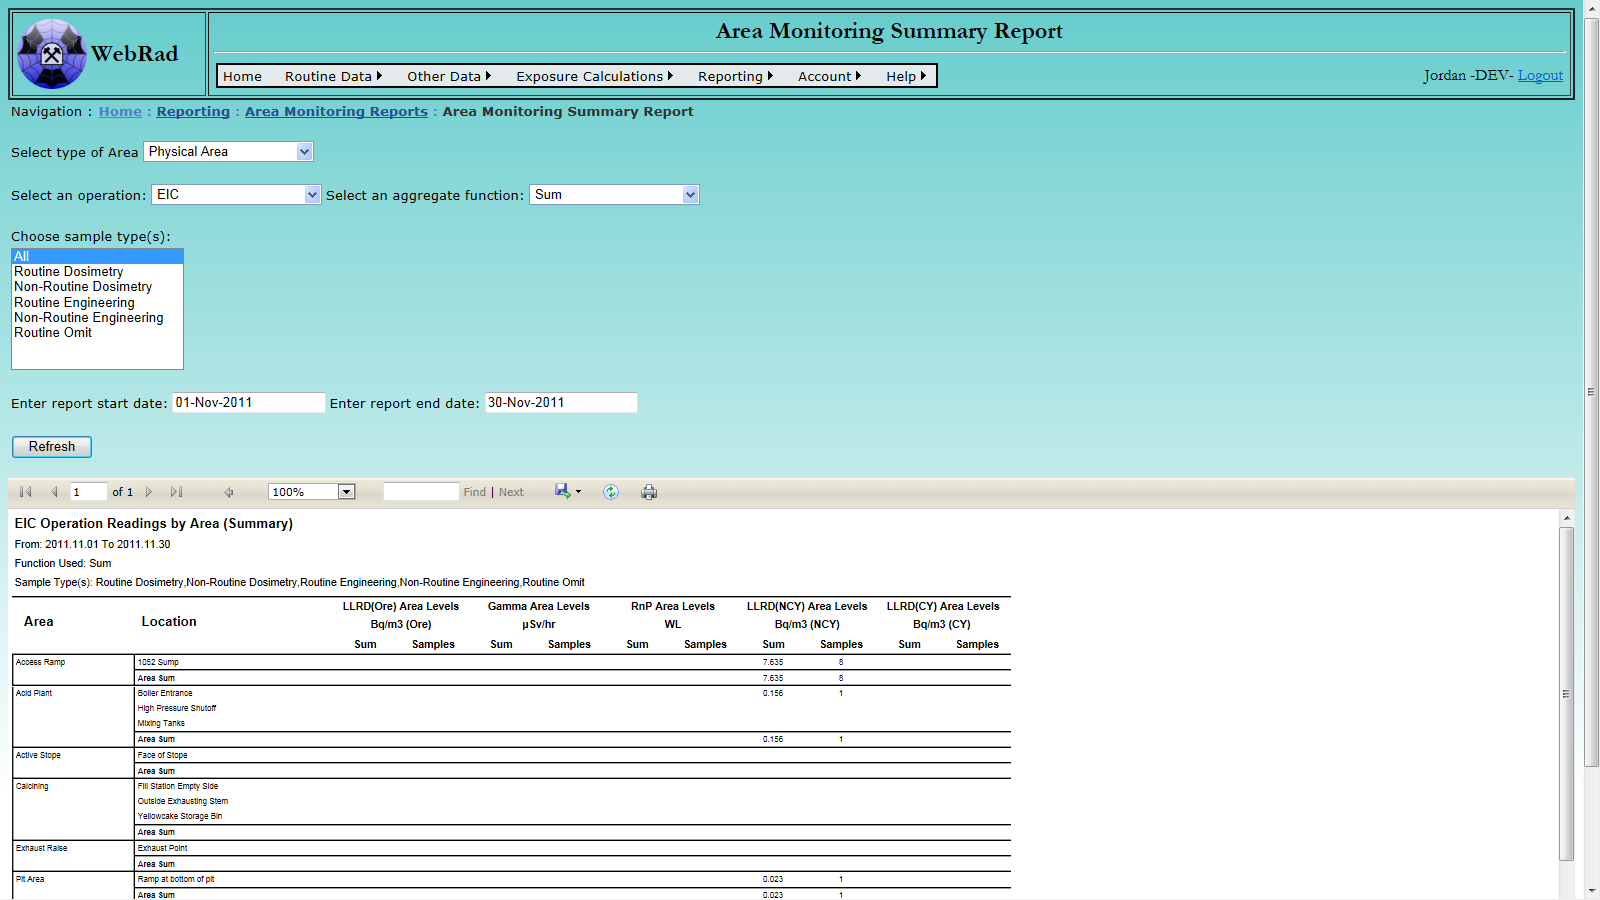
12.1.3 COP Daily Report
To get to the report mouse over "Reports" on the menu bar, go down "Area Monitoring Reports" then go over and click on the "COP Daily Report" link. This report is used to display readings that are larger than those allowed by the preset "Codes Of Practise" limits.
First select the Operation for which the report is to be ran. Pick the appropriate reporting "Start" and "End" dates. When choosing a date range the start date time will be set to 00:00:00 and the end date time will be set to 23:59:59. Click the "Refresh" button to get the report to display. If any data was incorrectly entered an error will appear beside the "Refresh" button indicated what has stopped the report from being generated.
Note: Sites that do not have COP values set up will not have COP excursions shown for their locations.
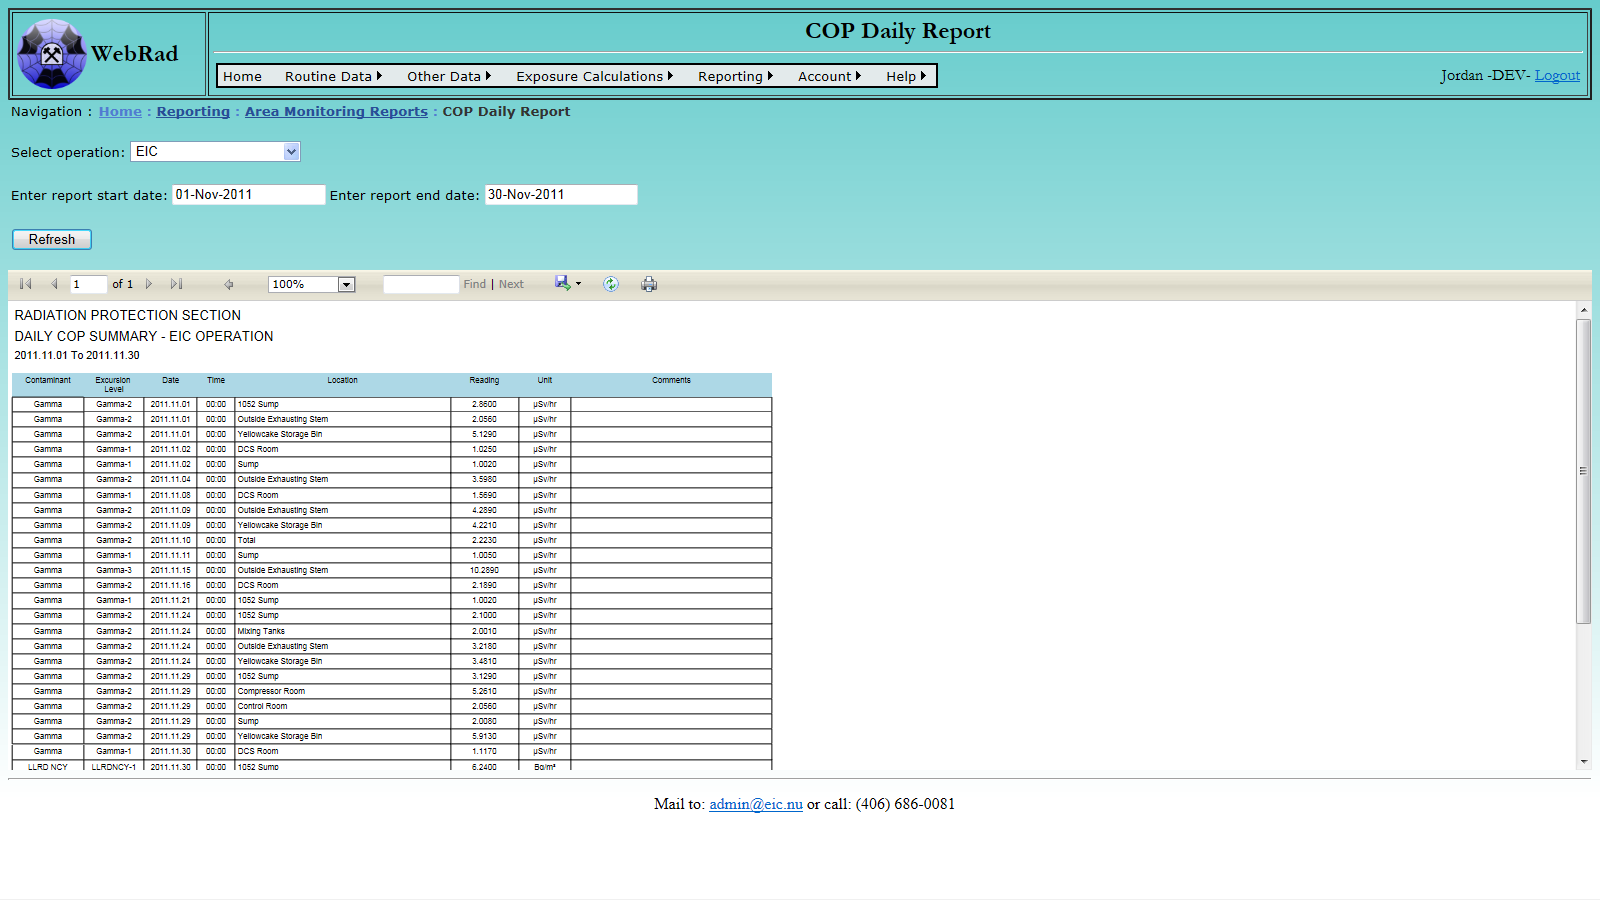
12.1.4 Daily Summary Report
To get to the report mouse over "Reports" on the menu bar, go down to "Area Monitoring Reports" then go over and click on the "Daily Summary Report" link. This report is used to display all readings for a given period of time. It also bolds values which exceed the predefined value at the bottom of the report and shows any COP excursions that exist. There is a choice to run this report for either Radon Progeny - Gamma or LLRD.
First select the Operation for which the report is to be ran. Next choose the type of report to run. There is an option for Radon Progeny - Gamma and an option for LLRD. Choose the "Sample Types" which are to be used. Multiple sample types can be selected by holding the "Ctrl" key on the keyboard and clicking the individual sample types with the mouse. Pick appropriate reporting "Start" and "End" dates. When choosing a date range the start date time will be set to 00:00:00 and the end date time will be set to 23:59:59. Click the "Refresh" button to get the report to display. If any data was incorrectly entered an error will appear beside the "Refresh" button indicated what has stopped the report from being generated.
Note: Sites that do not have COP values set up will not have COP excursions shown for their locations.
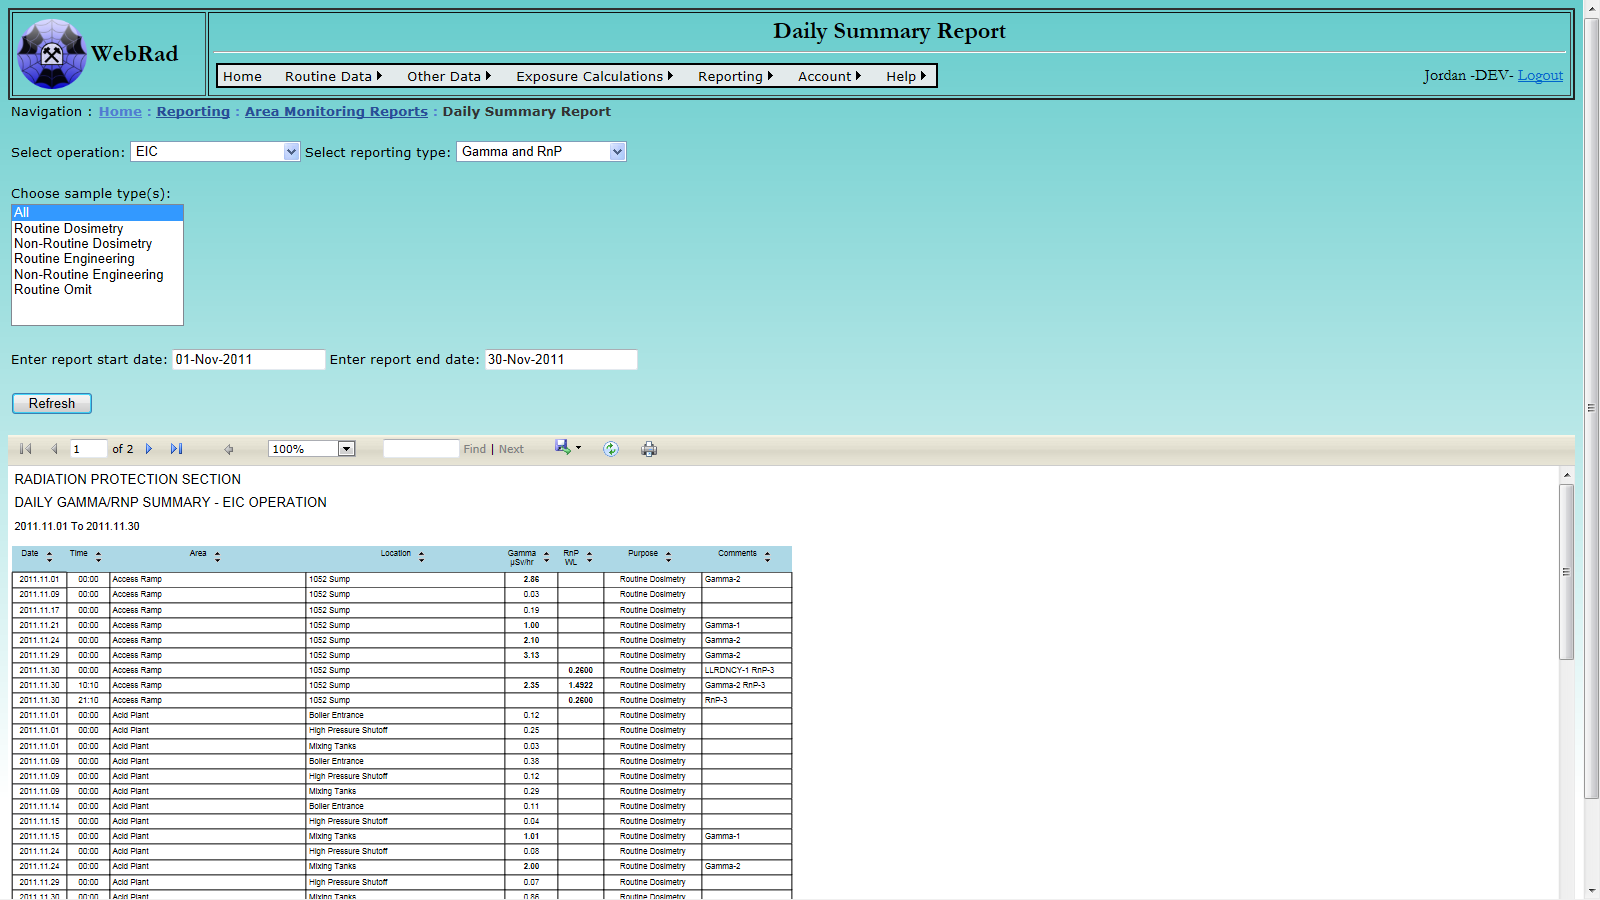
12.1.5 Location Report
The location report provides summary information of contaminant readings based on sites, sampling areas and locations. This data can be used to quickly analyse what locations have high or low readings, or to determine which locations should have readings taken more or less frequently.
Mouse over "Reporting" on the menu bar, go down to "Area Monitoring Reports" then go over and click on the "Locations Report" link. Start by choosing the appropriate Contaminants to appear in the report. Multiple Contaminants may be selected by holding down the "Ctrl" button on the keyboard and highlighting multiple Contaminants. Next choose the appropriate Sample Types for the readings. Multiple Sample Types may be selected in a similar manner to choosing Contaminants. Choose the date range you want to view readings over. Once everythin is selected click on the "Refresh" button to display the report.
This report takes the form of a drilldown report. Click the [+] icon next to a site name to view the sampling areas within the site and the [+] icon next to sampling area names to view the locations within the sampling area.
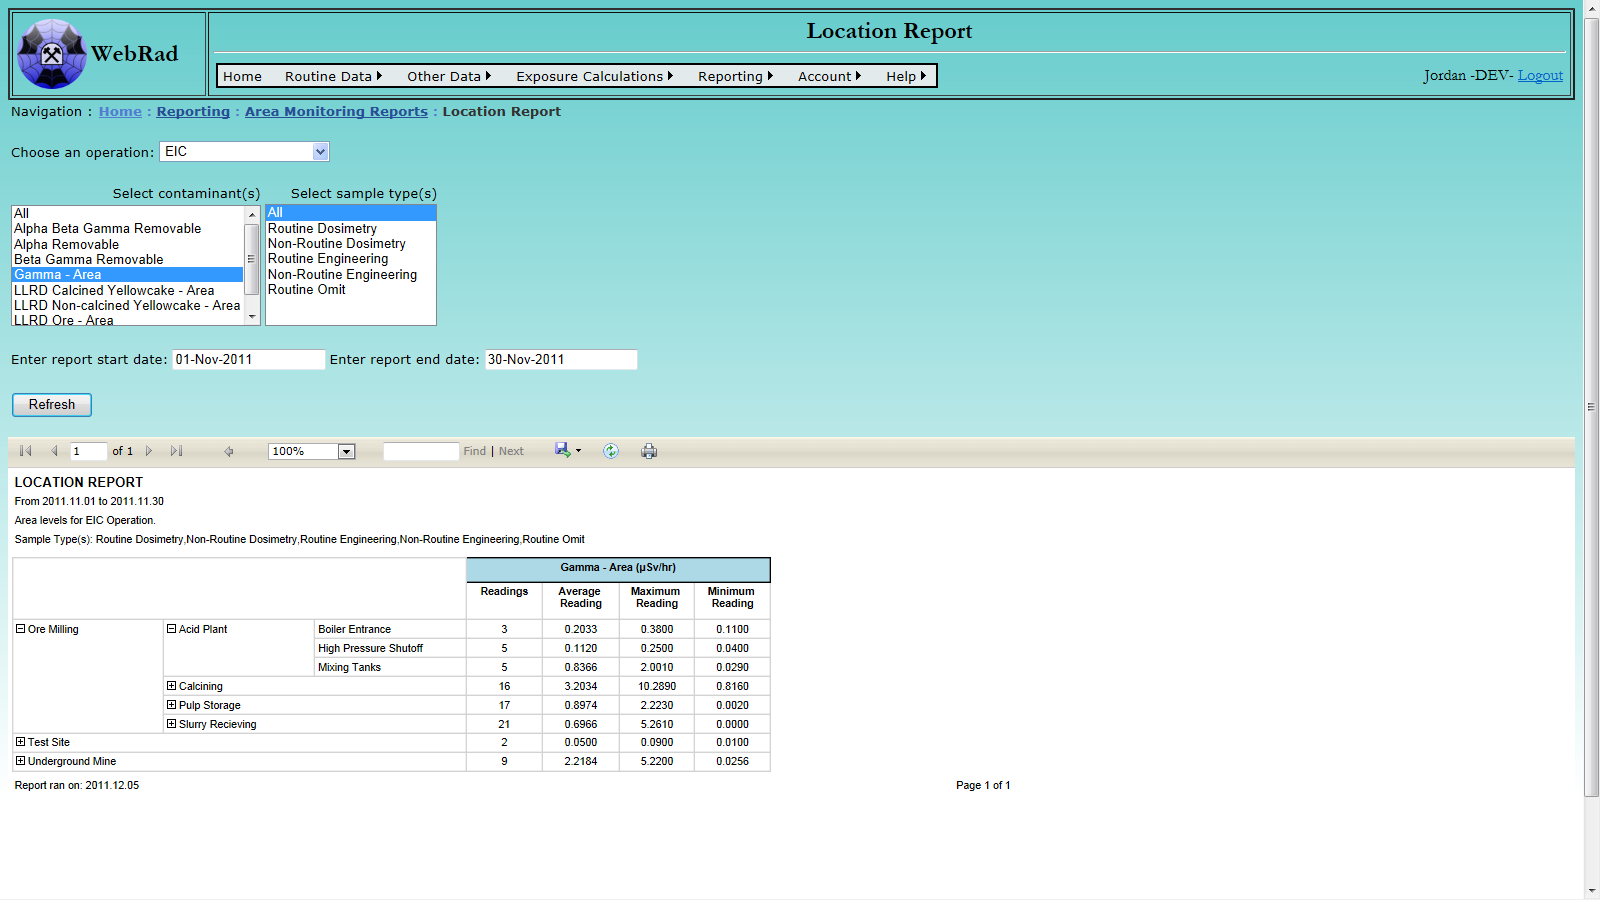
12.1.6 Readings Report
The readings report provides summary information of contaminant readings based on sites, sampling areas and locations. This report allows the user to select various contaminant input methods and displays detailed data that is associated with each reading entry such as equipment used, raw sample counts, count time, etc.
Mouse over "Reporting" on the menu bar, go down to "Area Monitoring Reports" then go over and click on the "Readings Report" link. Start by choosing the appropriate reading entry method. The multiple selection list boxes may then be used to filter the result set by the appropriate parameters. Multiple selections can be made by holding down the 'Ctrl' key while picking items from the lists. The clear filter button can be used to remove all selections from the filter list boxes. Choose the date range you want to view readings over. Once everythin is selected click on the "Refresh" button to display the report.
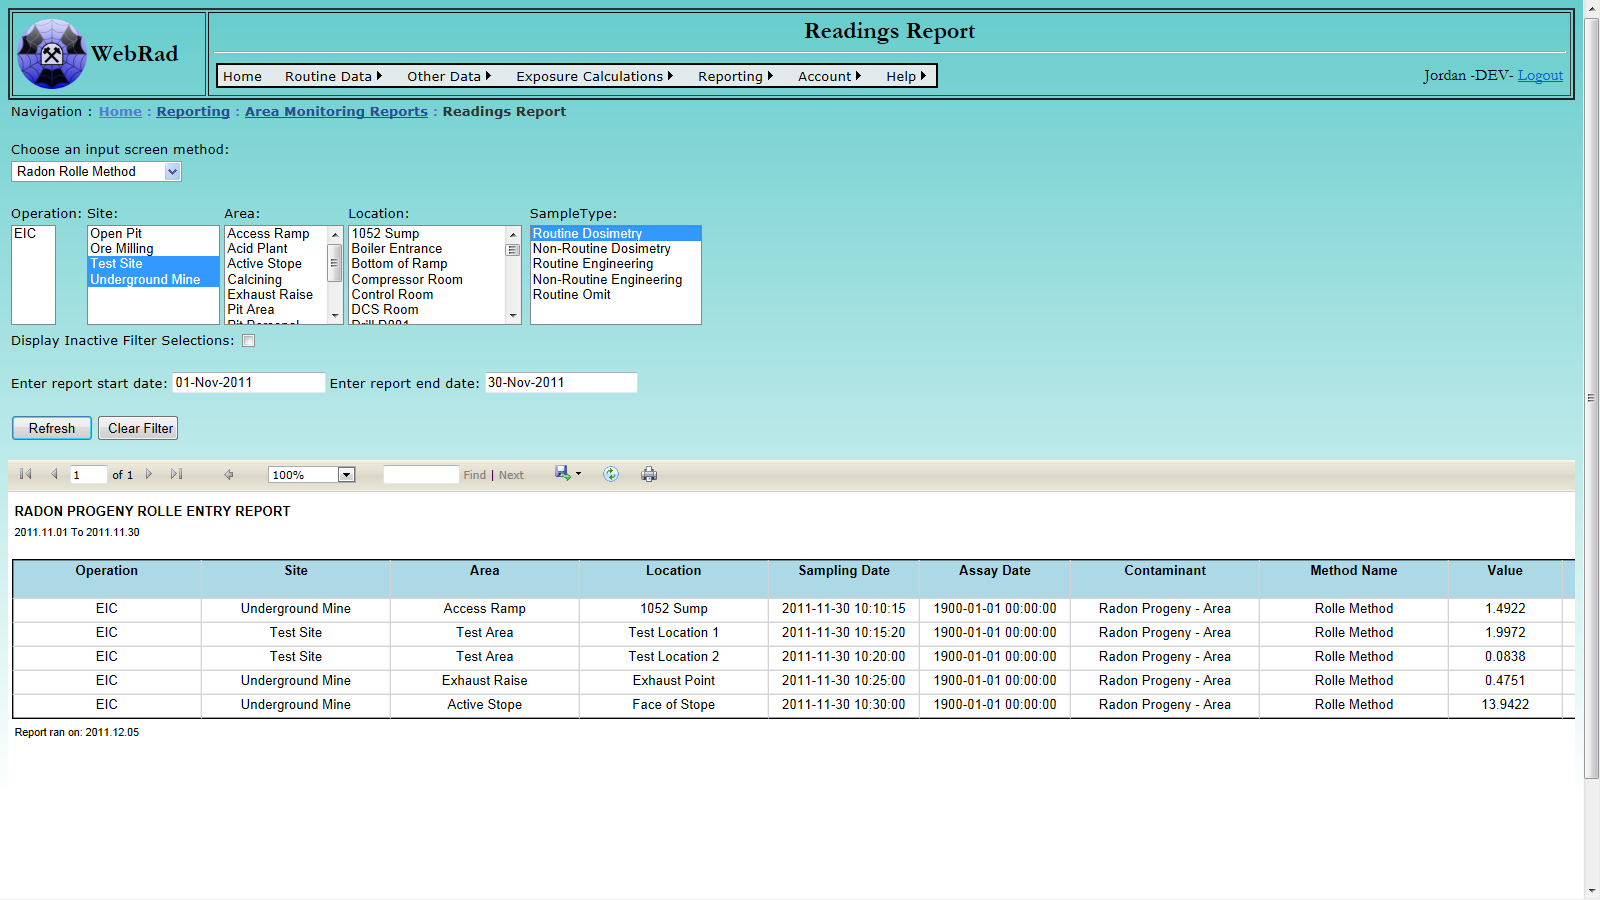
12.2 Personal Monitoring Reports
These reports are used to inspect worker dose. The majority of these reports are based off of stored monthly data and hence monthly calculations will have to be up to date prior to running these reports. This is described in a disclaimer at the top of the report. The only reports that do not use stored data and rather calculate values on the fly are those that given the option to use a date range of a daily resolution, like the "Top N% Report".
12.2.1 CNSC Exposure Report
To get to the report mouse over "Reports" on the menu bar, go down to "Personal Monitoring Reports" then go over and click on the "CNSC Exposure Report" link. This report is used to send out monthly exposure results to the Canadian Nuclear Safety Commission. Workers are brought into this report if they have time cards in WebRad, or if they have Personal Readings which are linked to Dose Components. This report runs from the start of the given year, up to the month selected. Workers that were designated as NEW's at any point during the year will be designated as NEW's in the report.
This report pulls exposure calculations from the monthly exposures table. This means that the table must be up to date prior to running this report.
To run the report, first choose the Operation from the drop down box. Next, select the Employee Group for which the report is to be ran, or select all groups. Select if the report should be ran for NEWs, and select the NDR codes to be displayed by the report. Multiple NDR codes may be selected by holding down the "Crtl" key on the keyboard and highlighting each NDR code. Select the Year and Month for the report to be ran and then click on the "Refresh" button to display the report. If there are any errors in the selections a message will be displayed beside the refresh button. Once displayed, the '+' sign beside the SIN column may be used to hide SIN's if required.
Special Note: The employee history used for each employee is selected by taking the history with the most recent 'Hire Date' that is less that the report end date. Also, If an employee has an employer other than the main employer, their NDR code will be prefixed with a 'C' and they will be placed in a separate category. Similarly, their NDR code will be prefixed with a 'N' for NEW classification and a 'x' for non-NEW classification.
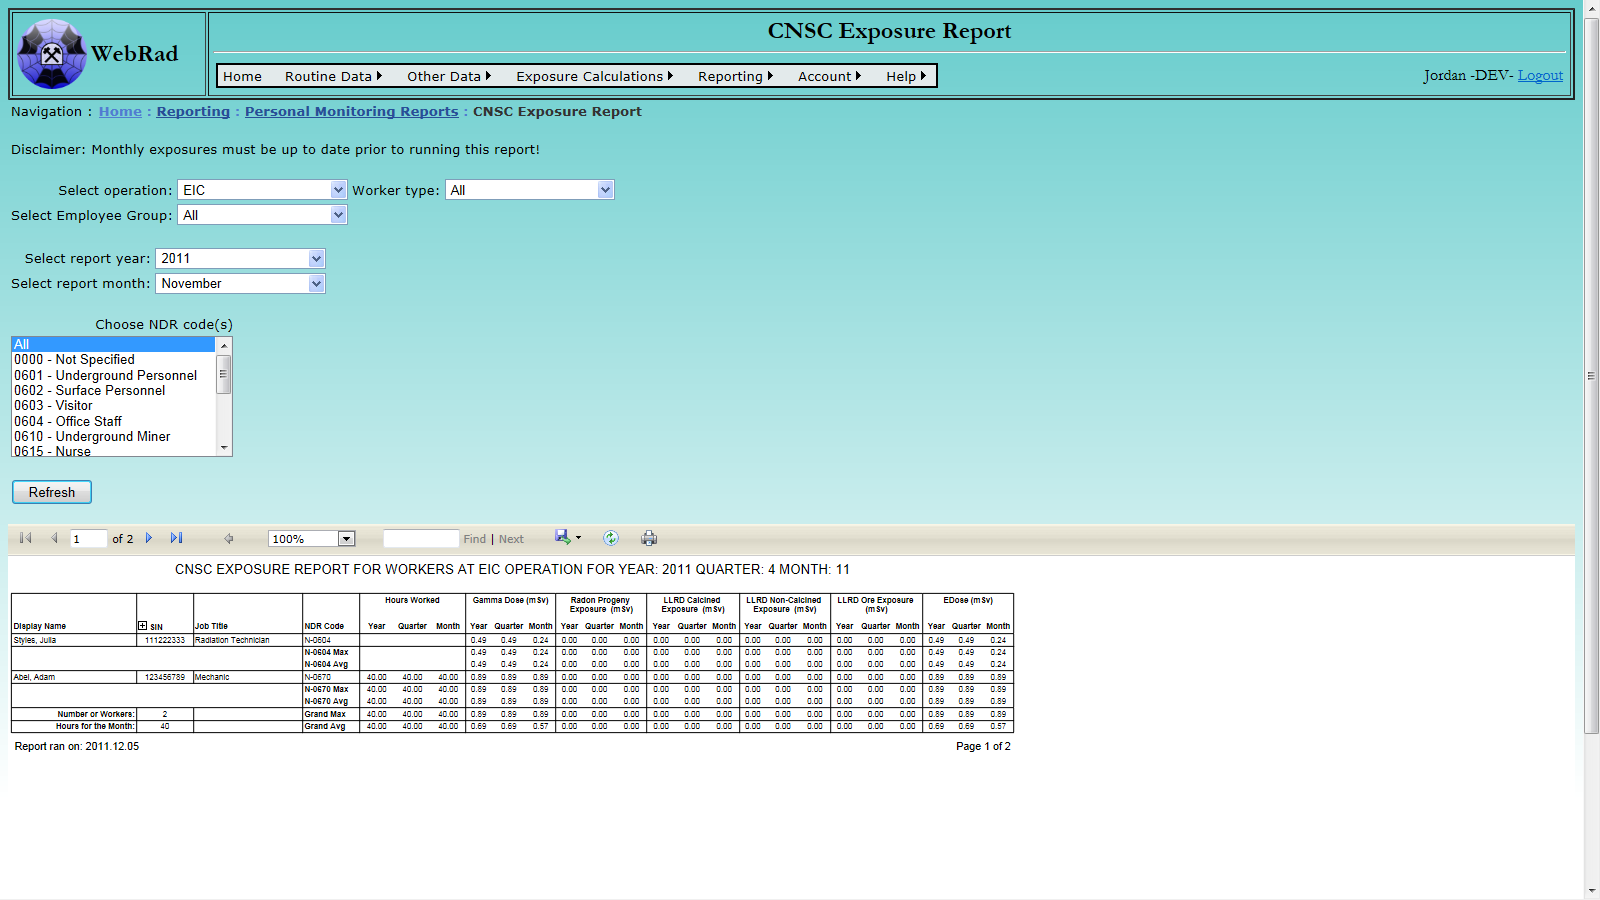
12.2.2 Personal Exposure Report
To get to the report mouse over "Reports" on the menu bar, go down to "Personal Monitoring Reports" then go over and click on the "Personal Exposure Report" link. This report is used to generate individual employee reports for a given quarter that summarize current and past exposure values. The interface to run this report allows the user to generate a batch of individual reports by selecting out groups of employees or allows individual reports to be generated based on a single selected employee. The input selections will change when toggling between running the report for an individual employee or a group of employees. These two interfaces are shown in the screen shots below.
This report pulls exposure calculations from the monthly exposures table. This means that the table must be up to date prior to running this report.
When generating a batch of reports, make sure that the "Select by individual employee?" check box is cleared. Choose the Operation and select the corresponding Employee Groups. Select the Worker Type (An employee is designated as a NEW if they are set to a NEW anytime during the year that the report is ran for). Select the NDR codes to be displayed by the reports. Multiple NDR codes may be selected by holding down the "Crtl" key on the keyboard and highlighting each NDR code. Finally, choose a Year and corresponding Quarter then click the "Refresh Buttton". If the report does not show up, any errors present in the selections will be displayed beside the refresh button.
When running the report for only a single employee, make sure that the "Select by individual employee?" check box is checked. By default, the list of employees will include only active employees. Checking the "Display inactive employees" check box will reload the employee list with all possible employees. Select the employee of interest from the drop down box, choose a Year and corresponding Quarter then click the "Refresh Buttton". If the report does not show up, any errors present in the selections will be displayed beside the refresh button.
Special Notes: employees are designated as a NEW if they were a NEW at all during the year selected in the drop down box. The employee history used for each employee is selected by taking the history with the most recent 'Hire Date' that is less that the report end date.
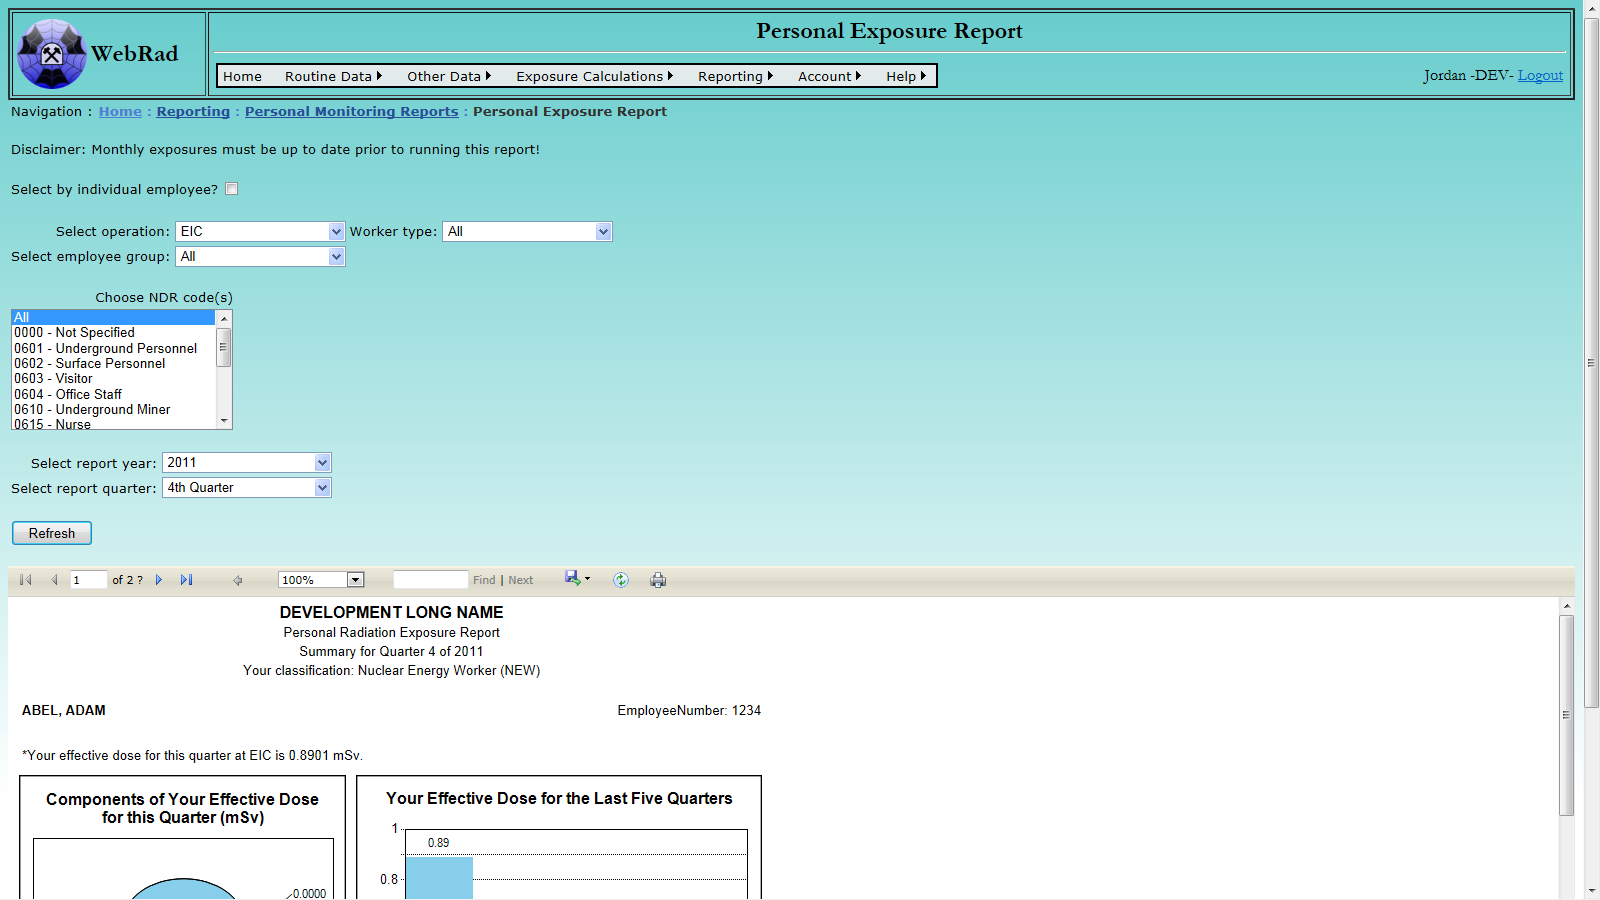
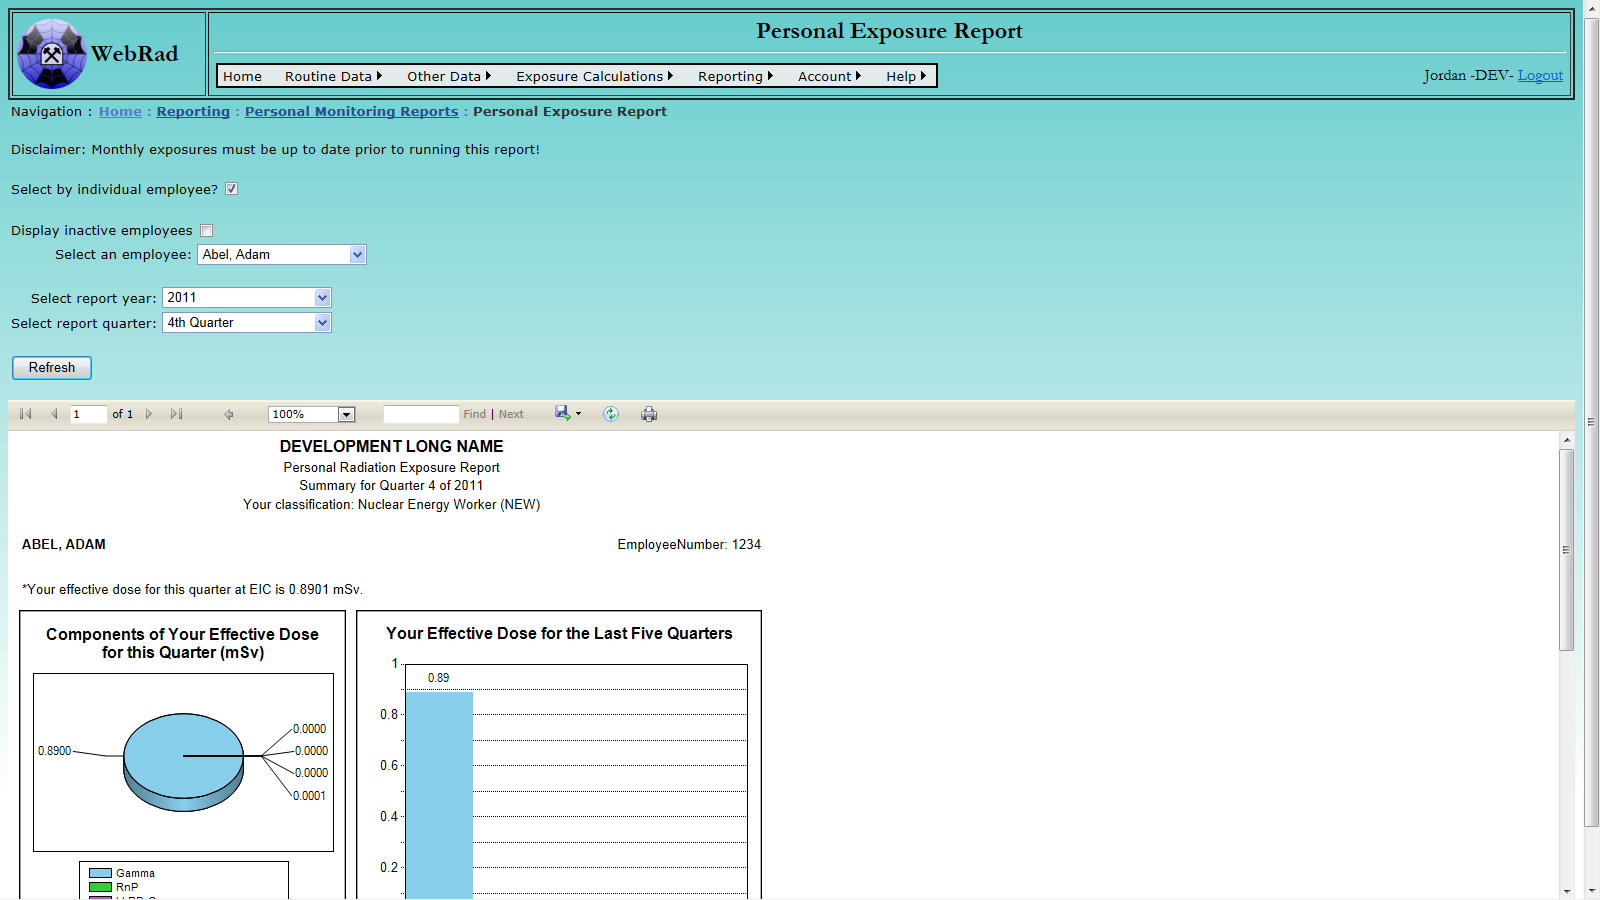
12.2.3 Quarterly NDR File
To get to the report mouse over "Reports" on the menu bar, go down to "Personal Monitoring Reports" then go over and click on the "Quarterly NDR File" link.
The generated file is formatted according to NDR requirements, and can be directly submitted to NDR. To generate the quarterly NDR file, mouse over "Reporting" on the menu bar, go down to "Personal Monitoring Reports" then go over and click on the "Quarterly NDR File" link.
Choose the quarter, year, and contaminant type you wish to generate the NDR file for from the drop down lists, and click the "Generate NDR File" button. Please note: if Long Lived Radioactive Dust is selected, a certain employee's dose will be the sum of all the related contaminant exposure data (Ore Dust, Uncalcinated Yellowcake, and Calcinated Yellowcake). The NDR file will be generated accordingly and a popup window will prompt you to save or open the file. If you have generated the NDR file before for the same quarter, year, and contaminant type, the newly generated file will overwrite the previous one.
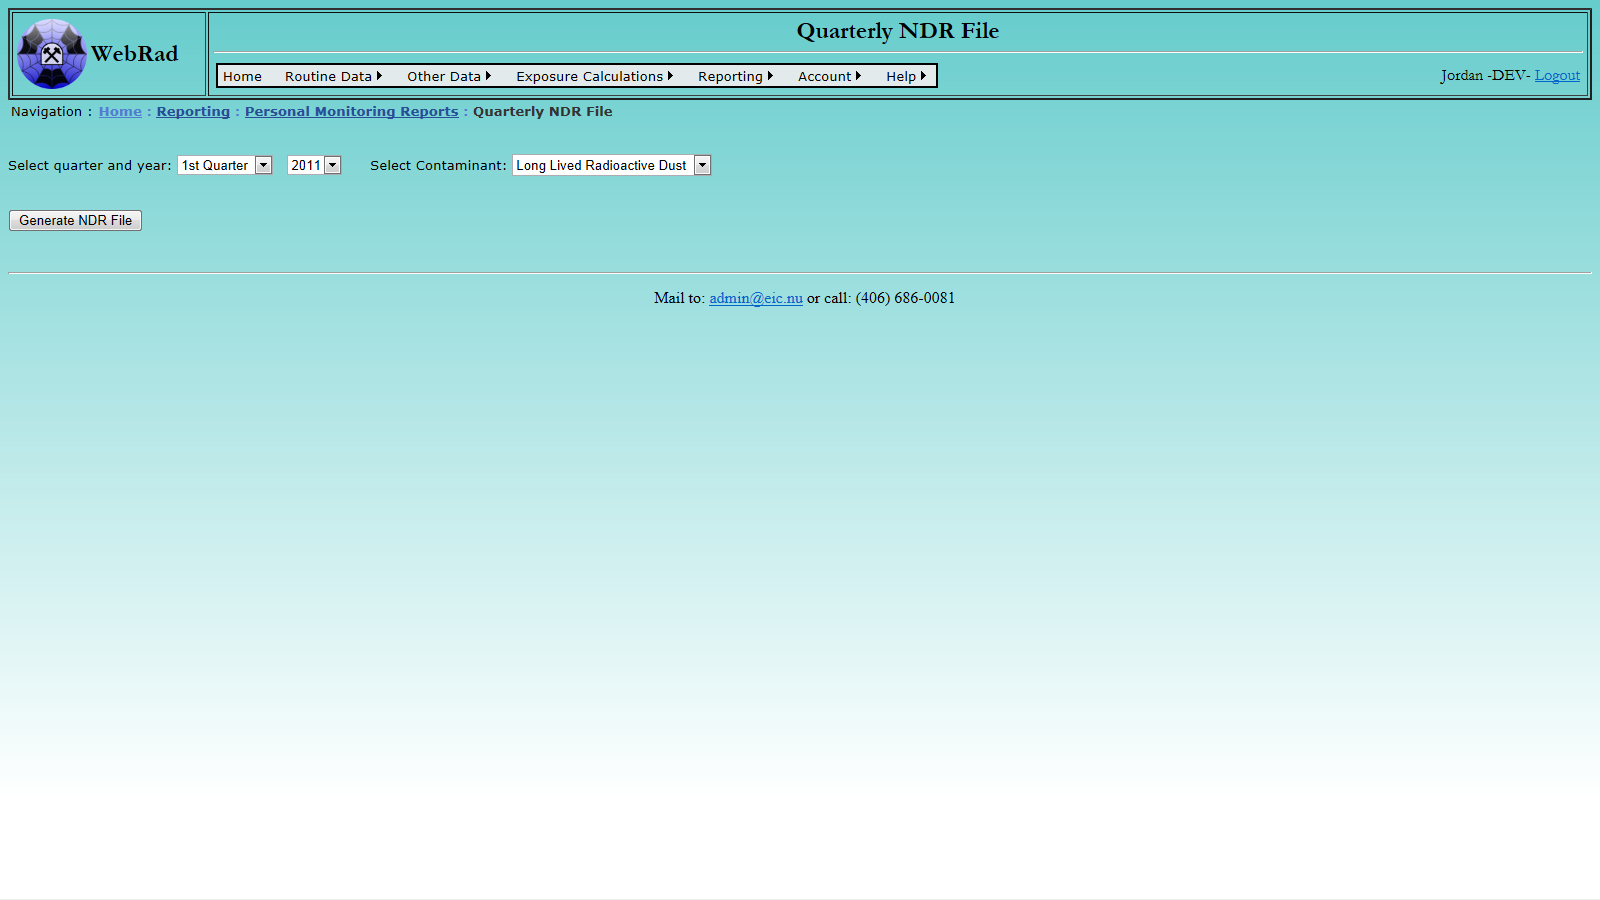
You can either open the file with your default text editor, normally it would be Notepad, or you can save the file to your disk.
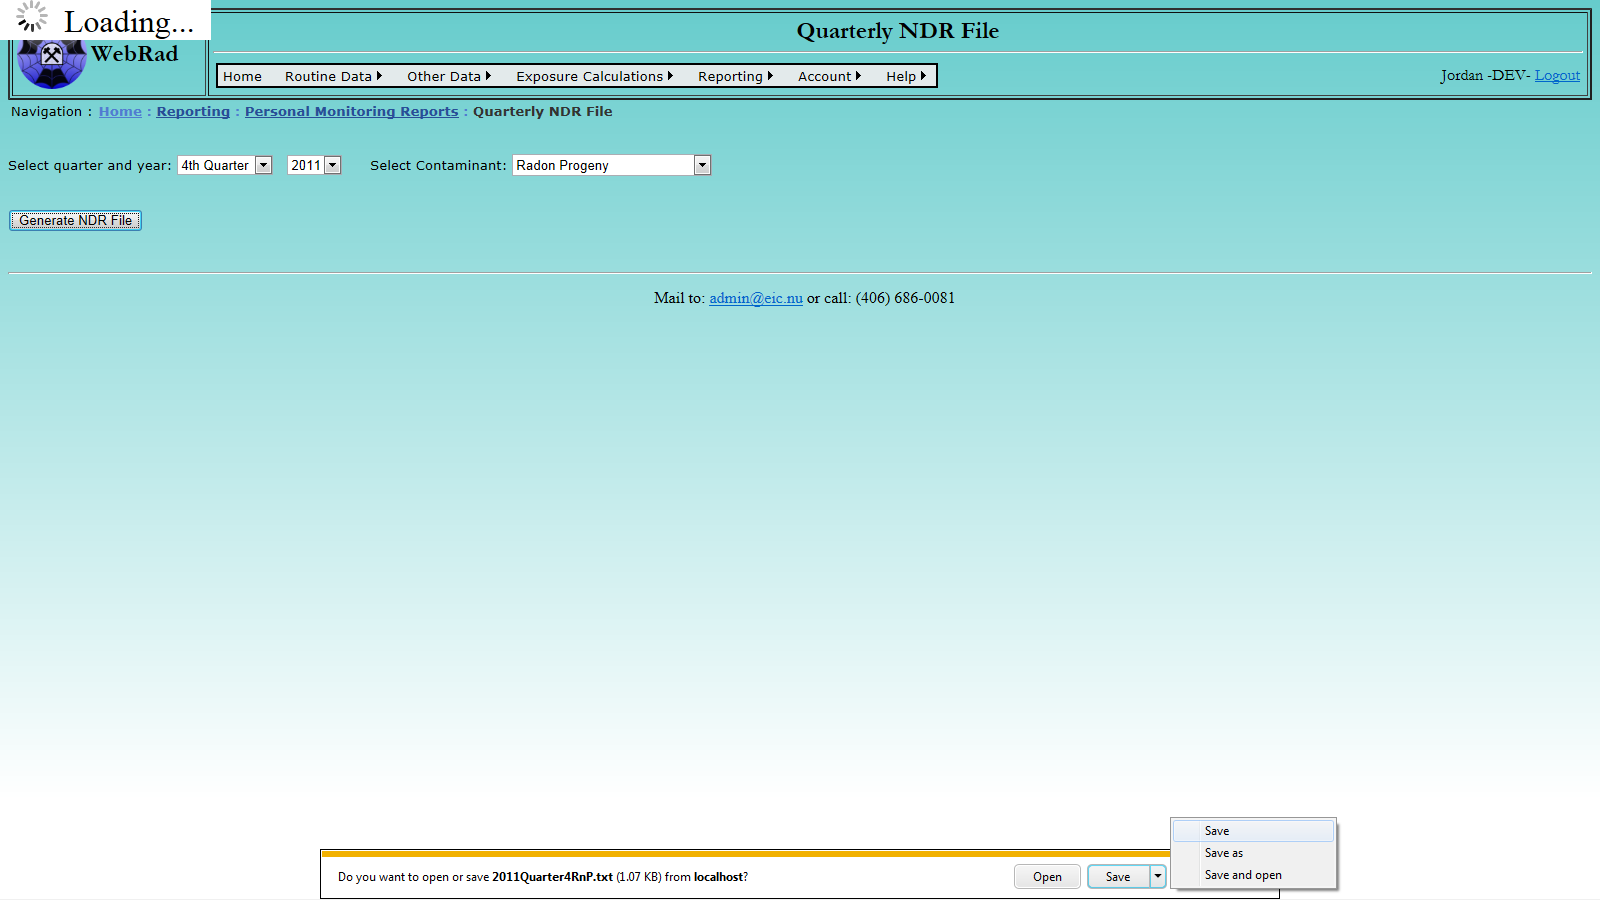
12.2.4 Quarterly Report
The quarterly report provides summary information of employee exposures during a given quarter as well as year to date effective dose. The report contains data on gamma, radon progeny and LLRD. If you have added other contaminants to the database they will not appear on the report, but their effective dose will be factored into the total dose.
A quarterly report can be generated once you have finished calculating your monthly exposures for the entire quarter. Ordinarily this would not be done until you have finalized and posted your monthly exposures, although it can be done at any time, and includes both unposted and posted data.
Mouse over "Reporting" on the menu bar, go down to "Personal Monitoring Reports" then go over and click on the "Quarterly Report" link. Choose the quarter and year you wish to generate the report for from the drop down lists. The menu bar at the top allows you to move through the pages for multiple page reports.
Note: Only employees who have monthly exposure data will appear on the list.
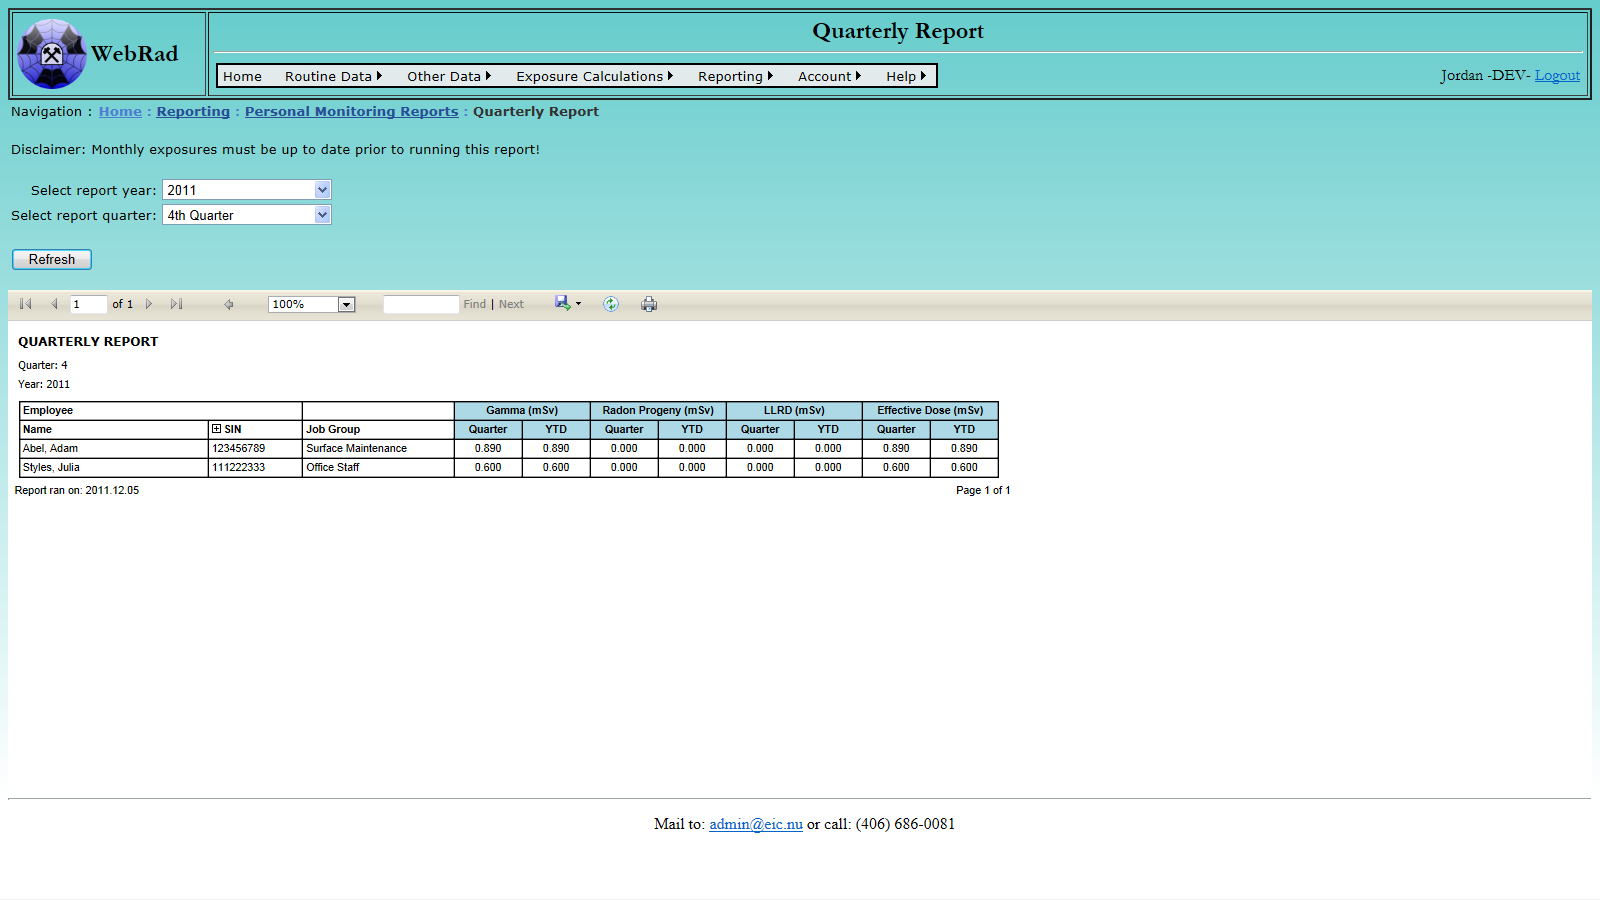
12.2.5 Running Year Dose Report
To get to the report mouse over "Reports" on the menu bar, go down to "Personal Monitoring Reports" then go over and click on the "Running Year Dose Report" link. This report is used to display a years worth of monthly dose data based on a starting month and year. Candidate for the report will be selected based on if they have times cards or personal dosimetry readings for the period selected. The doses expressed are those which are stored in the monthly exposures table, so it is important that this table be up to date prior to running this report.
Select the desired Operation. The Employee Group drop down will be filtered based on the Operation. Chooose the Employee Group and corresponding NDR Code(s). Next choose if you wish to display Nuclear Energy workers by making a selection from the Worker Type drop down. Next, choose the dose component you wish to run the report for. There is the option to run it for each individual component or for the groups provided (LLRD and Total by default). Finish the selection by choosing the month and year to start the report from. Select the "Refresh" button and the report will display below shortly. Due to its size this report is not formated to be exported in a printable format.
The report groups individuals into their associated NDR codes and classifies them as NEW's (NDR code prefixed with a 'N' for NEW 'x' for nonNEW) and contractors (NDR code prefixed with a 'C' for those individuals with employers not set to the primary employer). The last page of the report contains a totals table that sums the the doses and hours for each of the individual NDR codes.
Special Note: Employees are designated as NEW's if they were an NEW at all during the selected report run period. The employee history used for each employee is selected by taking the most relevant history corresponding to the report end date. Also note, that if an hours column appears blank it means that employee did not have any timecards for the period but they did have dosimeters or other personal readings which dose could be calculated by. Further more, if an employee is shown with no exposures or timecards, that means they do not have stored monthly exposures when they should indeed have them.
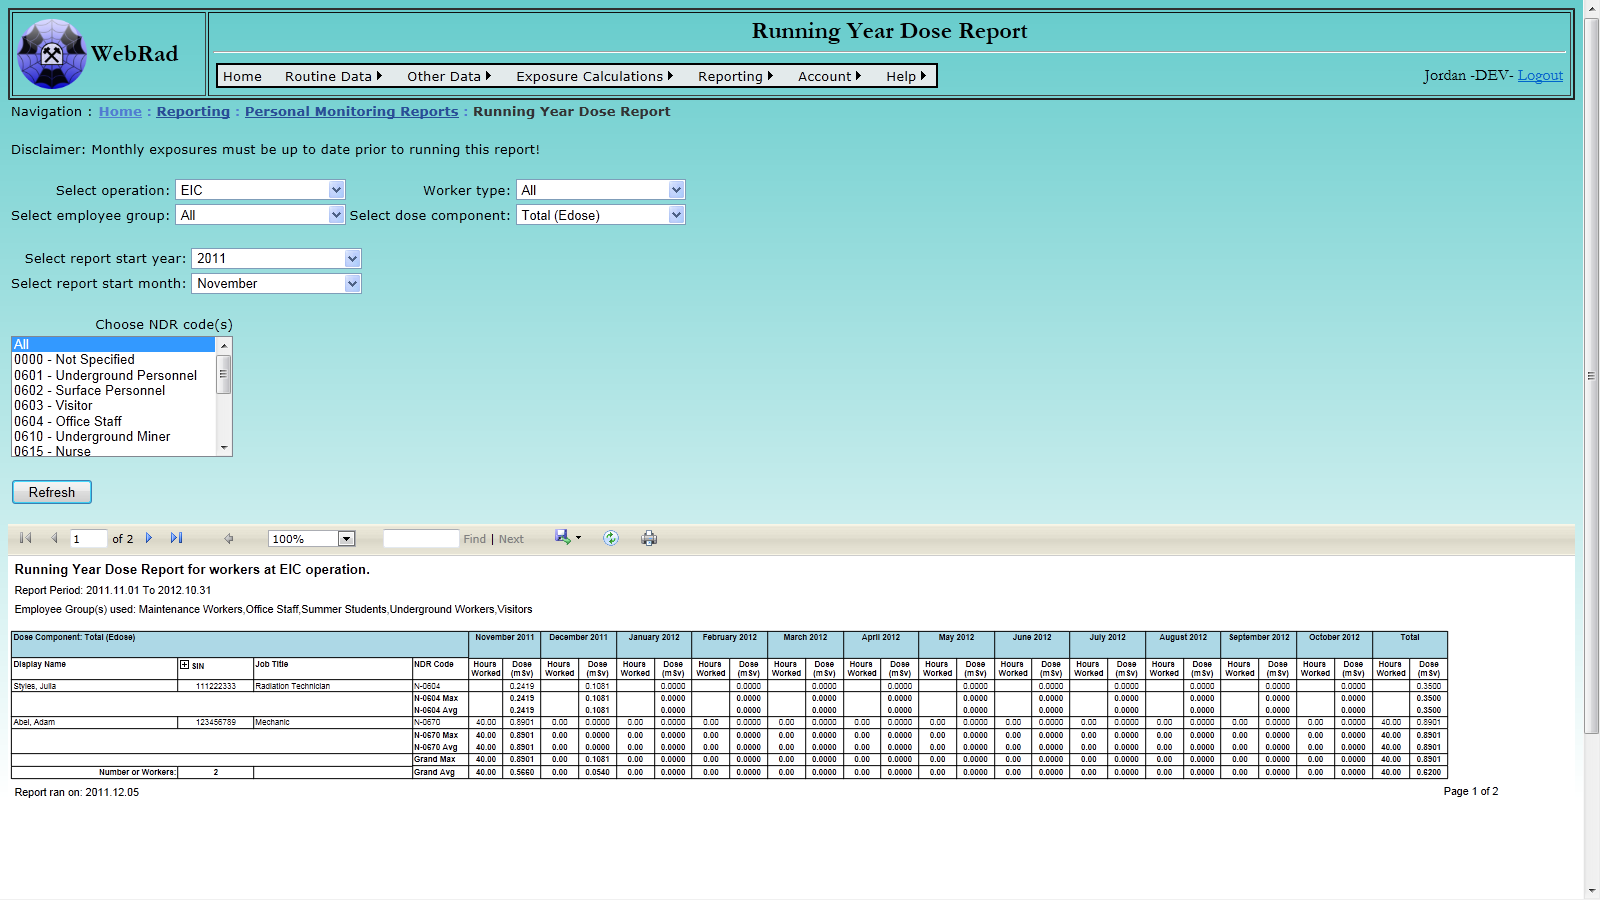
12.2.6 Radiation Work Permit Report
To get to the report mouse over "Reports" on the menu bar, go down to "Personal Monitoring Reports" then go over and click on the "Radiation Work Permit Report" link. This report is used to determine the amount of radiation exposure from various components of a Radiation Work Permit. This report runs from the start of the given year, up to the month selected. Workers that were designated as NEW's at any point during the year will be designated as NEW's in the report.
To run the report, first choose the Operation from the drop down box. Next, select the Employee Group for which the report is to be ran, or select all groups. Select if the report should be ran for NEWs, and select the type of Radiation Work Permit to view values for. Select the NDR codes to be displayed by the report. Multiple NDR codes may be selected by holding down the "Crtl" key on the keyboard and highlighting each NDR code. Select the Year and Month for the report to be ran and then click on the "Refresh" button to display the report. If there are any errors in the selections a message will be displayed beside the refresh button. Once displayed, the '+' sign beside the SIN column may be used to hide SIN's if required.
Special Note: The employee history used for each employee is selected by taking the history with the most recent 'Hire Date' that is less that the report end date. Also, If an employee has an employer other than the main employer, their NDR code will be prefixed with a 'C' and they will be placed in a separate category. Similarly, their NDR code will be prefixed with a 'N' for NEW classification and a 'x' for non-NEW classification.
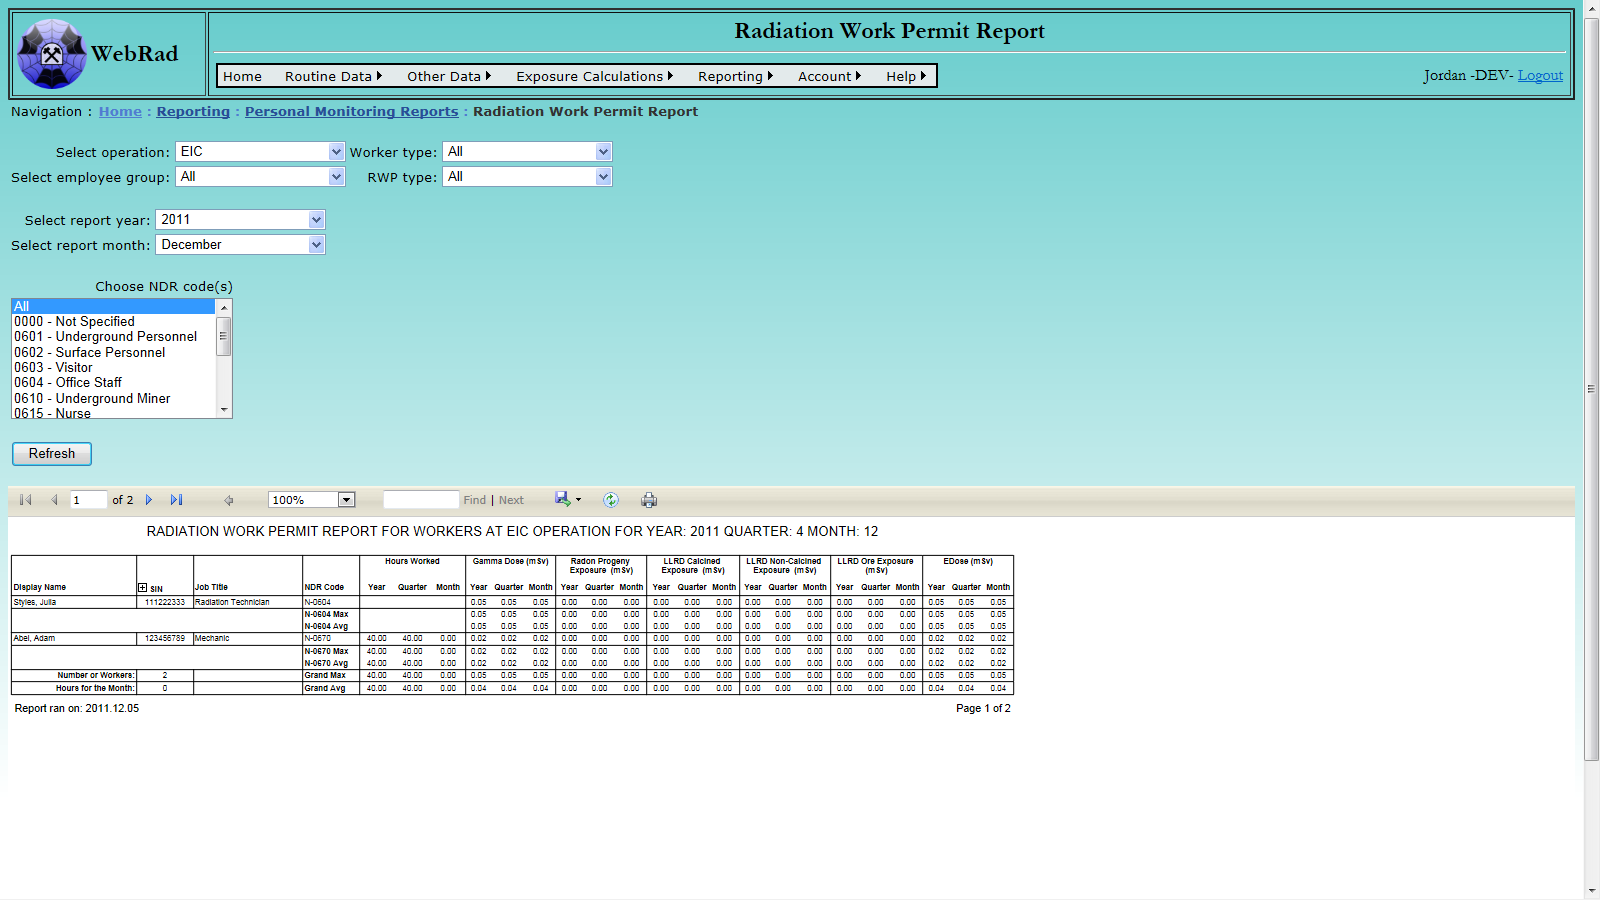
12.2.7 Top N% Report
To get to the report mouse over "Reports" on the menu bar, go down to "Personal Monitoring Reports" then go over and click on the "Top N% Report" link. This report is used to generate the top N% highest exposures for employees given the filtering criteria selected. N can be any number from 0 to 100.
Select the desired Operation. The Employee Group drop down will be filtered based on the Operation. Chooose the Employee Group and NDR Code. Next choose the Worker Type. Finally, select a valid start and end date and then select the "Refresh" button. An asterisk is the NEW column of the report signifies an employee as a NEW.
Special Note: Employees are designated as NEW's if they were an NEW at all during the selected report run period. The employee history used for each employee is selected by taking the history with the most recent 'Hire Date' that is less that the report end date.
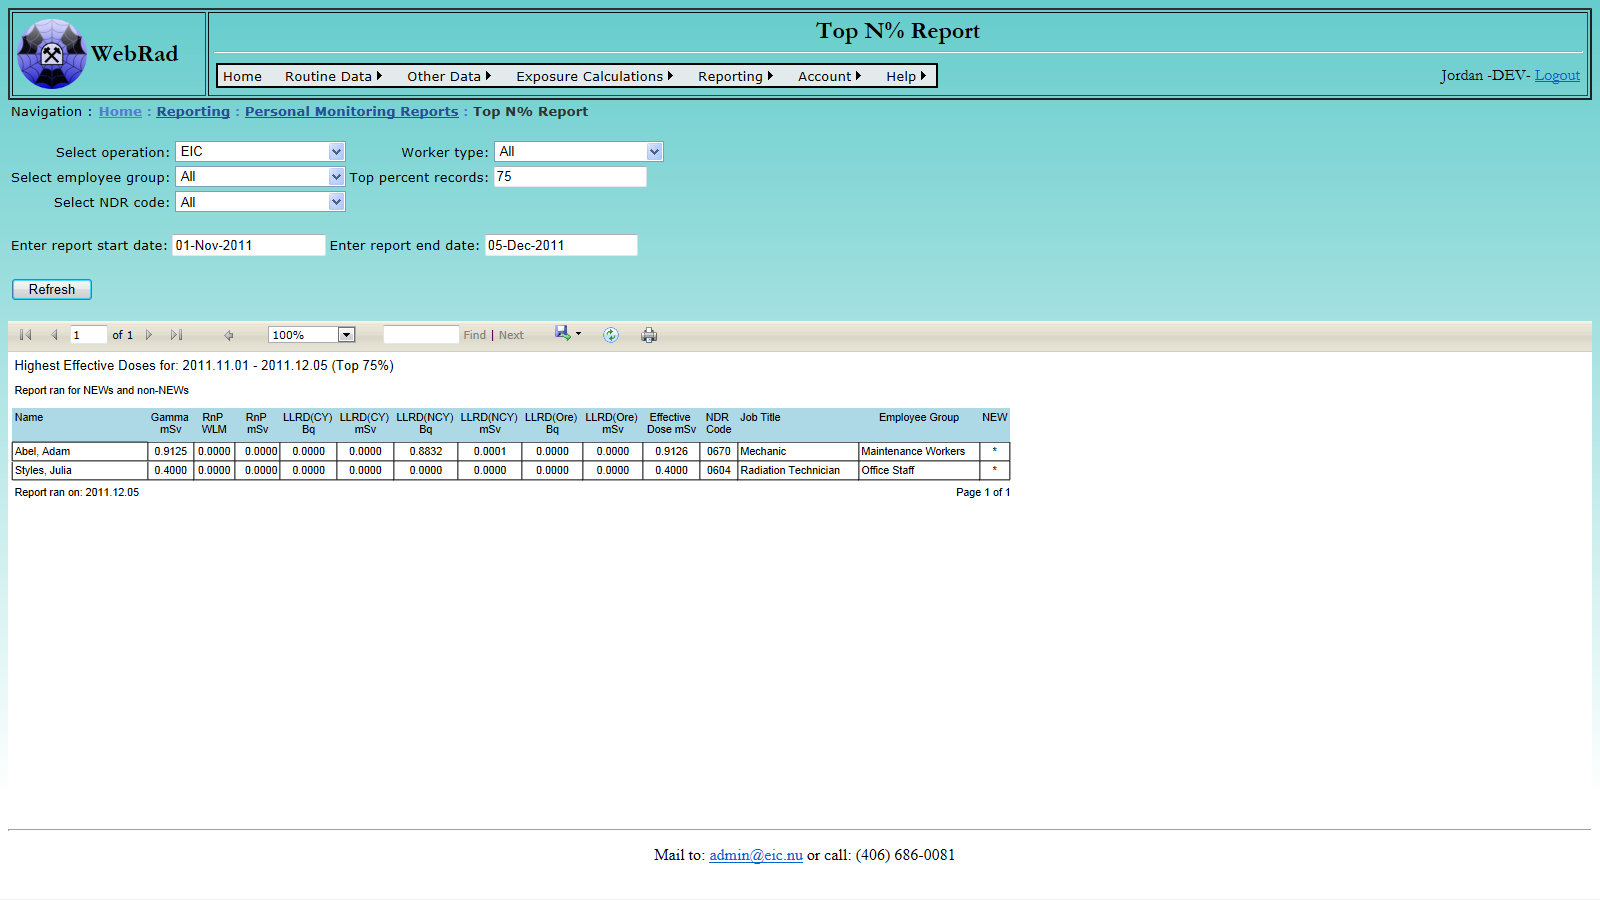
12.2.8 U in U Report
To get to the report mouse over "Reports" on the menu bar, go down to "Personal Monitoring Reports" then go over and click on the "U in U Report" link. This report is used to generate Uranium Bioassay results for individuals.
Begin by selecting the operation of choice. Next select the employee groups for the report to be ran for. Select the worker type and aggregate function. See below for a description of the aggregate function choice. Select the NDR codes you wish to pull people based on, and the UinU sample types to be used in the report. Finally, select an appropriate date range and click on the 'Refresh' button to display the report.
This report is actaully a combination of two separate reports. Selecting an aggregate of 'None' directs the report to a simple list of all UinU results for the period specified for all people with results. The last page of this report gives a frequency distribution that looks at all samples for each employee group selected. Choosing an aggregate other than 'None' results in a report that displays the aggregate of each individuals total number of samples a long with a count of the samples used to make that aggregate. The report also groups individuals into their associated NDR codes and classifies them as NEW's (NDR code prefixed with a 'N' for NEW 'x' for nonNEW) and contractors (NDR code prefixed with a 'C' for those individuals with employers not set to the primary employer). For each of these groupings is an associated group total with aggregates all of the samples in the group and a grand total at the end of the report.
Special Note: Employees are designated as NEW's if they were an NEW at all during the selected report run period. The employee history used for each employee is selected by taking the history with the most recent 'Hire Date' that is less that the report end date.
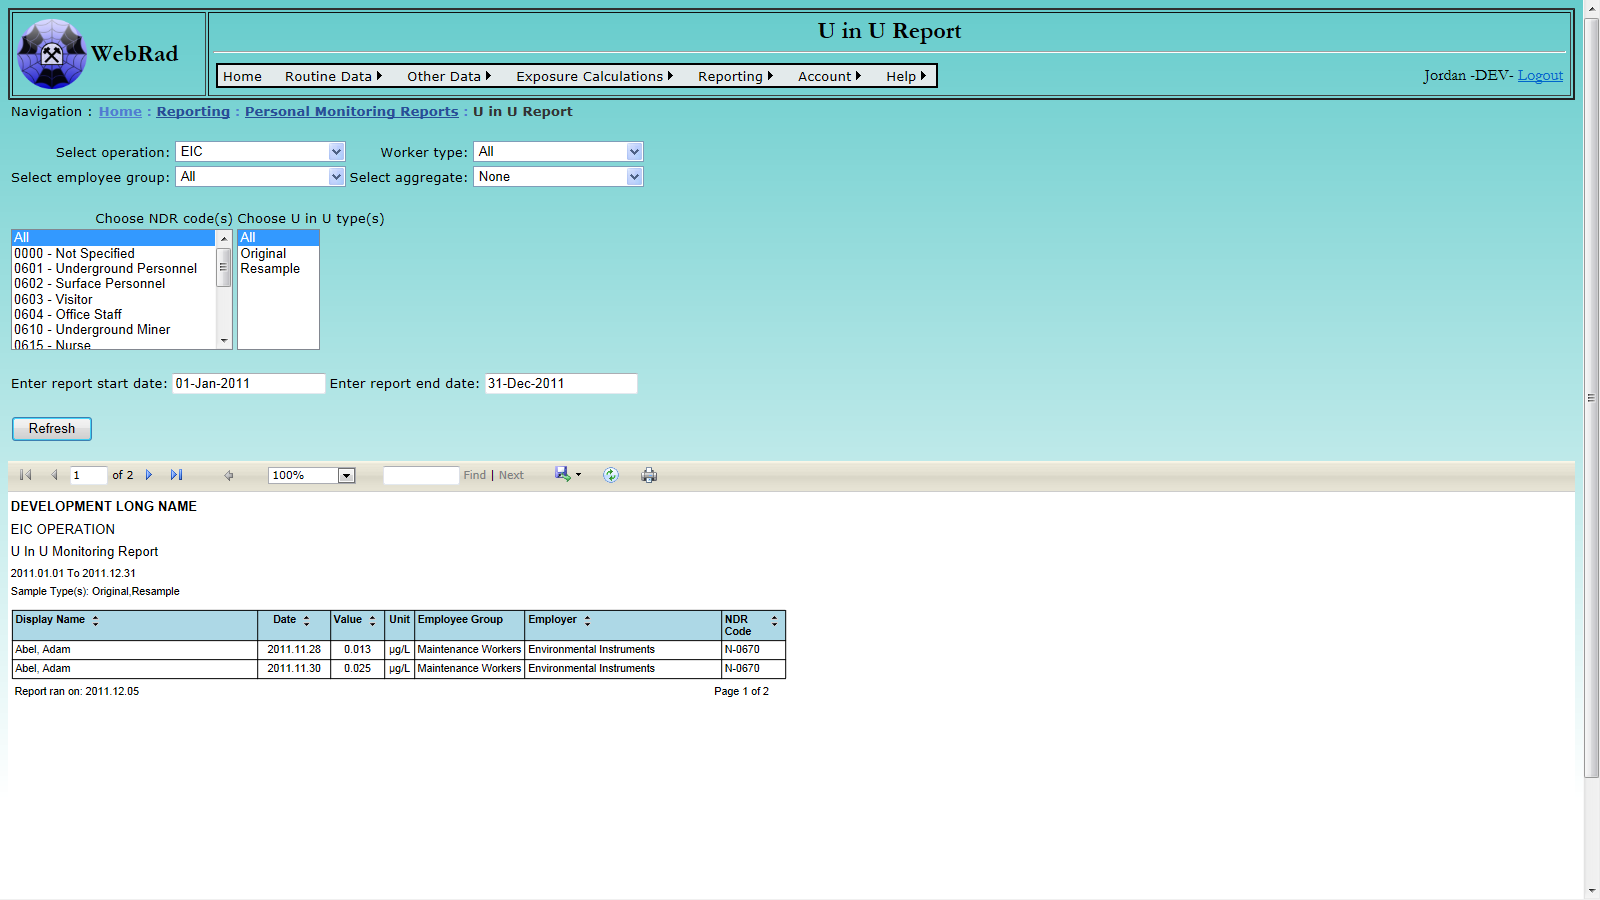
12.2.9 Worker List Report
To get to the report mouse over "Reports" on the menu bar, go down to "Personal Monitoring Reports" then go over and click on the "Worker List Report" link. This report is used to generate a list of employees based on their active status in the database.
Select whether the report is to be ran for Hired, Terminated, or All employees and then click on the "Refresh" button to generate the report.
Special Note: The employee history used is that for which the current entry is set to true.
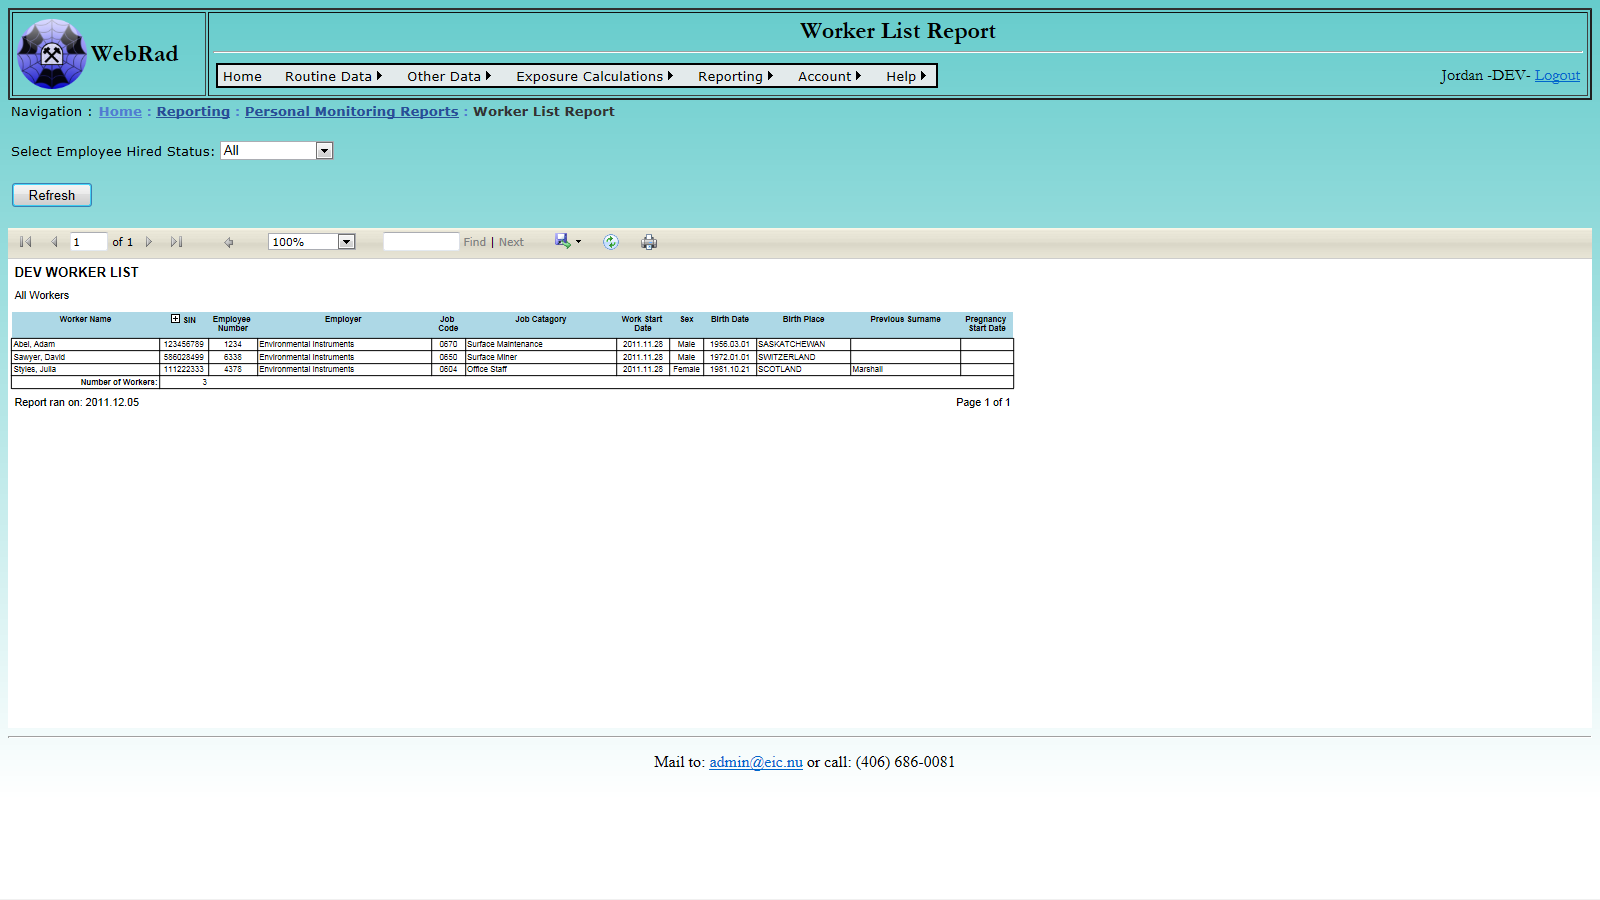
12.2.10 Yearly Report
To get to the report mouse over "Reports" on the menu bar, go down to "Personal Monitoring Reports" then go over and click on the " Yearly Report" link. This report is used to display a years worth of calculated exposures for all of the employees in the database.
Select the desired year to run the report and press the "Refresh" button to generate the report.
Special Note: An employees job group is selected by taking the most relevant history corresponding to the report end date.
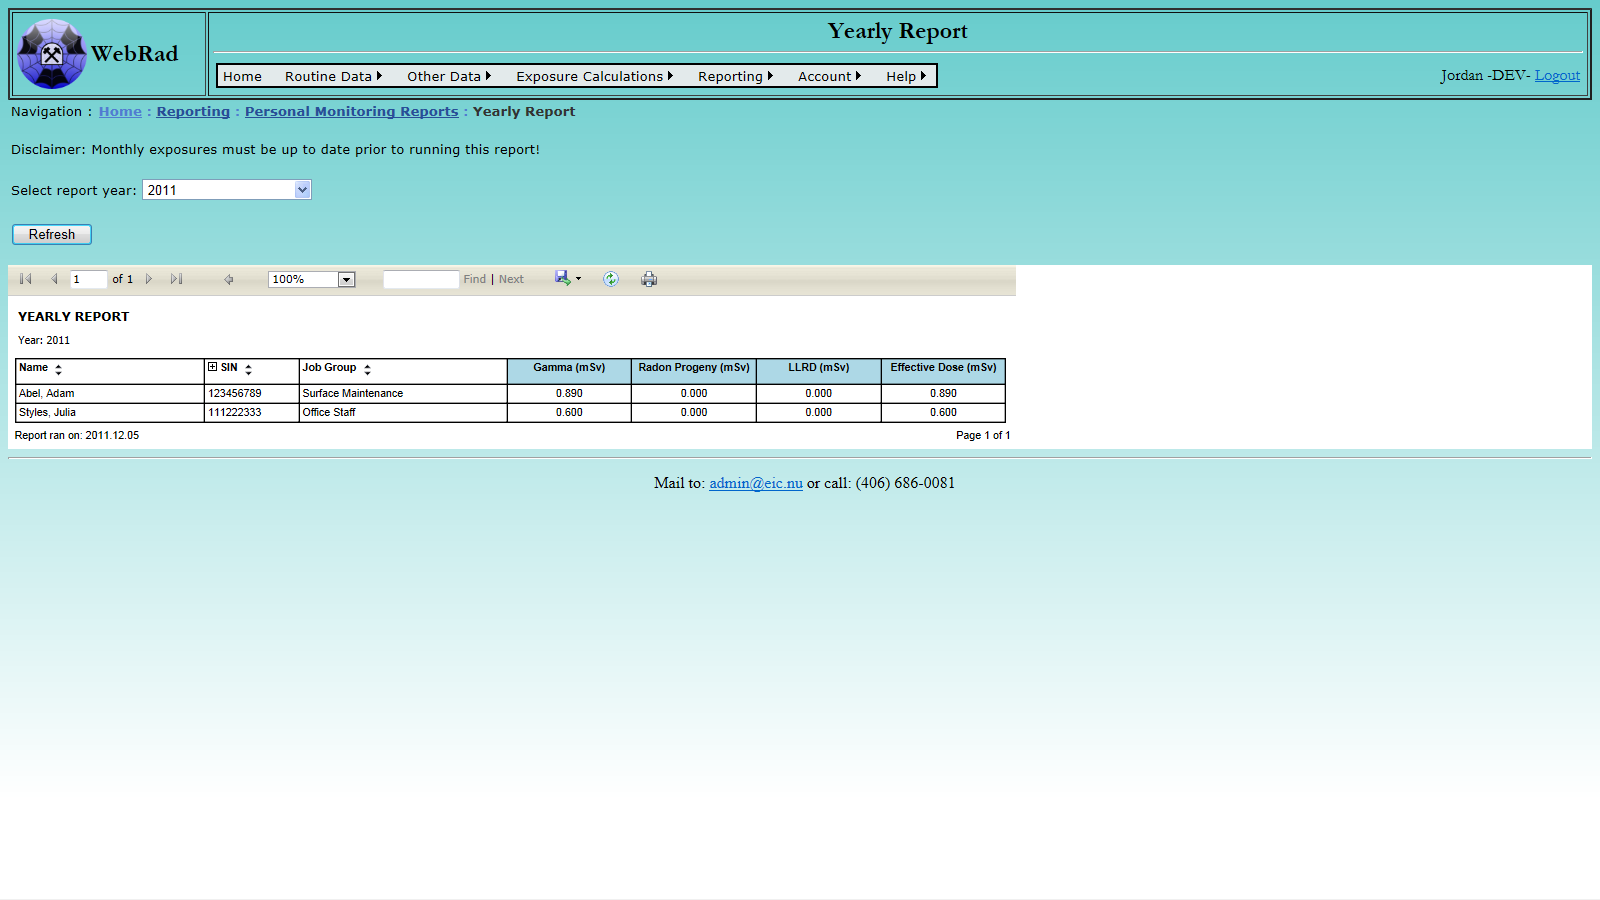
12.3 Annual Reporting Suite
This category of reports is used to generate year end statistics based on groups of employees. Because the smallest division of time for these reports is a single month, they are based off of the monthly stored exposures table. This means that prior to running these reports, all monthly data must be up to date.
12.3.1 Collective Total Dose by NDR and Month
To get to the report mouse over "Reports" on the menu bar, go down to "Annual Reporting Suite" then go over and click on the "Collective Total Dose by NDR and Month" link. This report is an operation specific report that generates the total dose for selected contaminants, based on a cross tabbed view of individual months verses NDR codes.
Select an Operation to run the report for. Select the Dose Component type to calculate totals for. Note that the LLRD selection contains all three LLRD contaminants (Ore, Calcined Yellowcake, and Non-Calcined Yellowcake). Next, choose the Year for which the report is to be ran. Finally, select the Worker Type and click on the "Refresh" button.
Special Note: Employees are categorized as NEW's if they were set as a NEW at all in the given report year. The employee history used for each employee is selected by taking the history with the most recent 'Hire Date' that is less that the report end date.
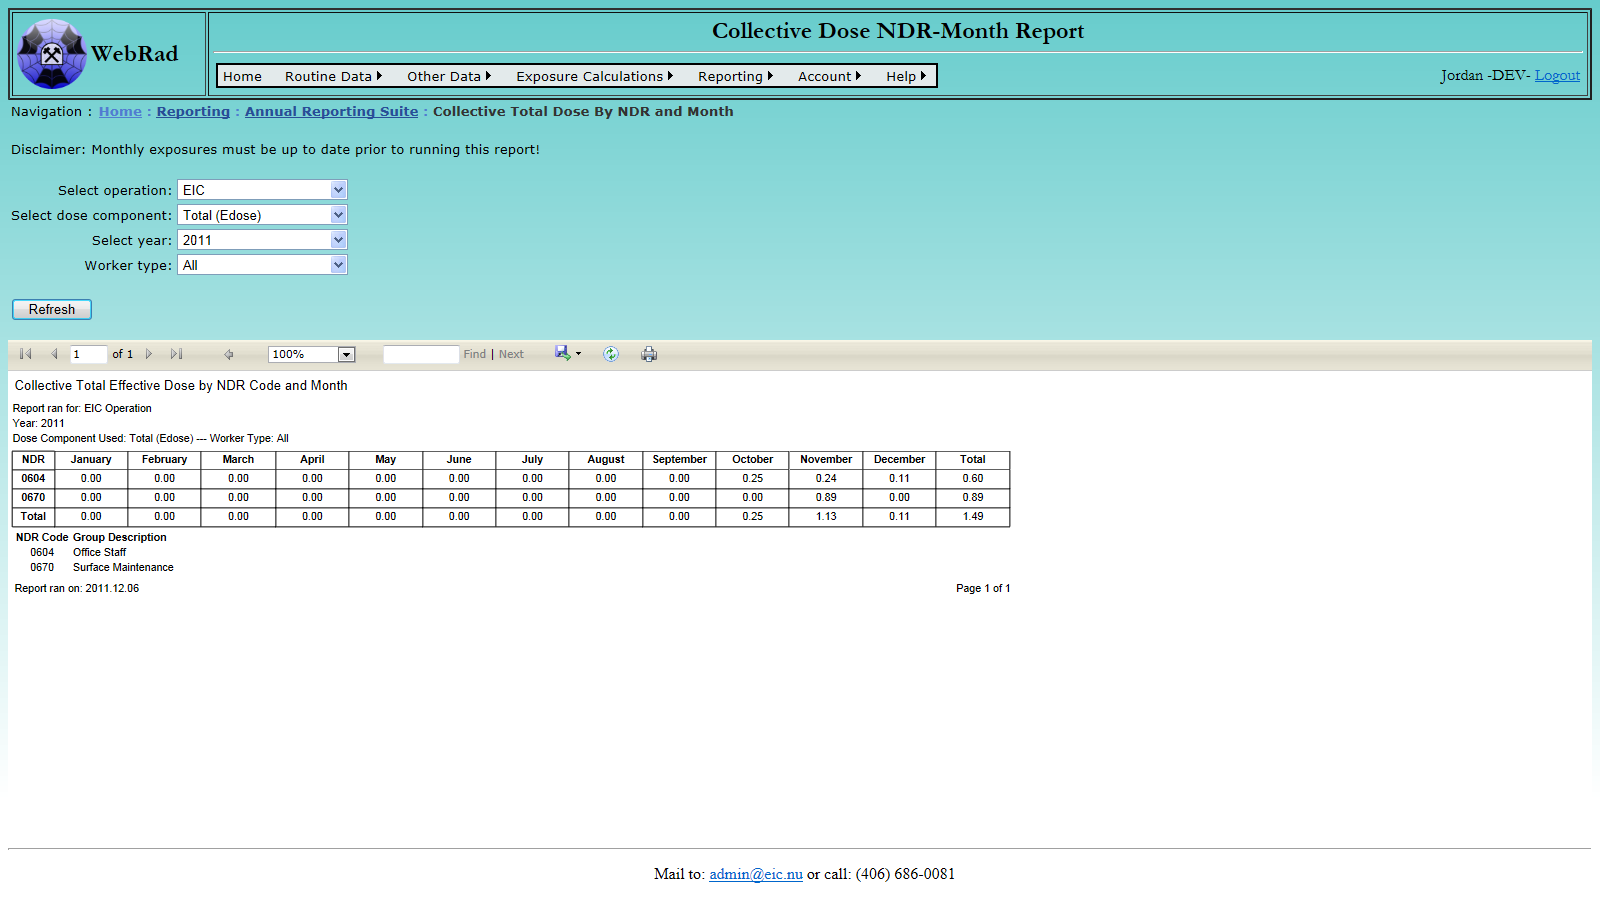
12.3.2 Dose Frequency by NDR Code
To get to the report mouse over "Reports" on the menu bar, go down to "Annual Reporting Suite" then go over and click on the "Dose Frequency by NDR Code" link. This report is an operation specific report that generates the total dose for selected contaminants, based on various dose bins for all of the different NDR codes existing in the reporting period.
Select an Operation to run the report for. Select the Dose Component type to calculate totals for. Note that the LLRD selection contains all three LLRD contaminants (Ore, Calcined Yellowcake, and Non-Calcined Yellowcake). Next, choose the Year for which the report is to be ran. Finally, select the Worker Type and click on the "Refresh" button.
Special Note: Employees are categorized as NEW's if they were set as a NEW at all in the given report year. The employee history used for each employee is selected by taking the history with the most recent 'Hire Date' that is less that the report end date.
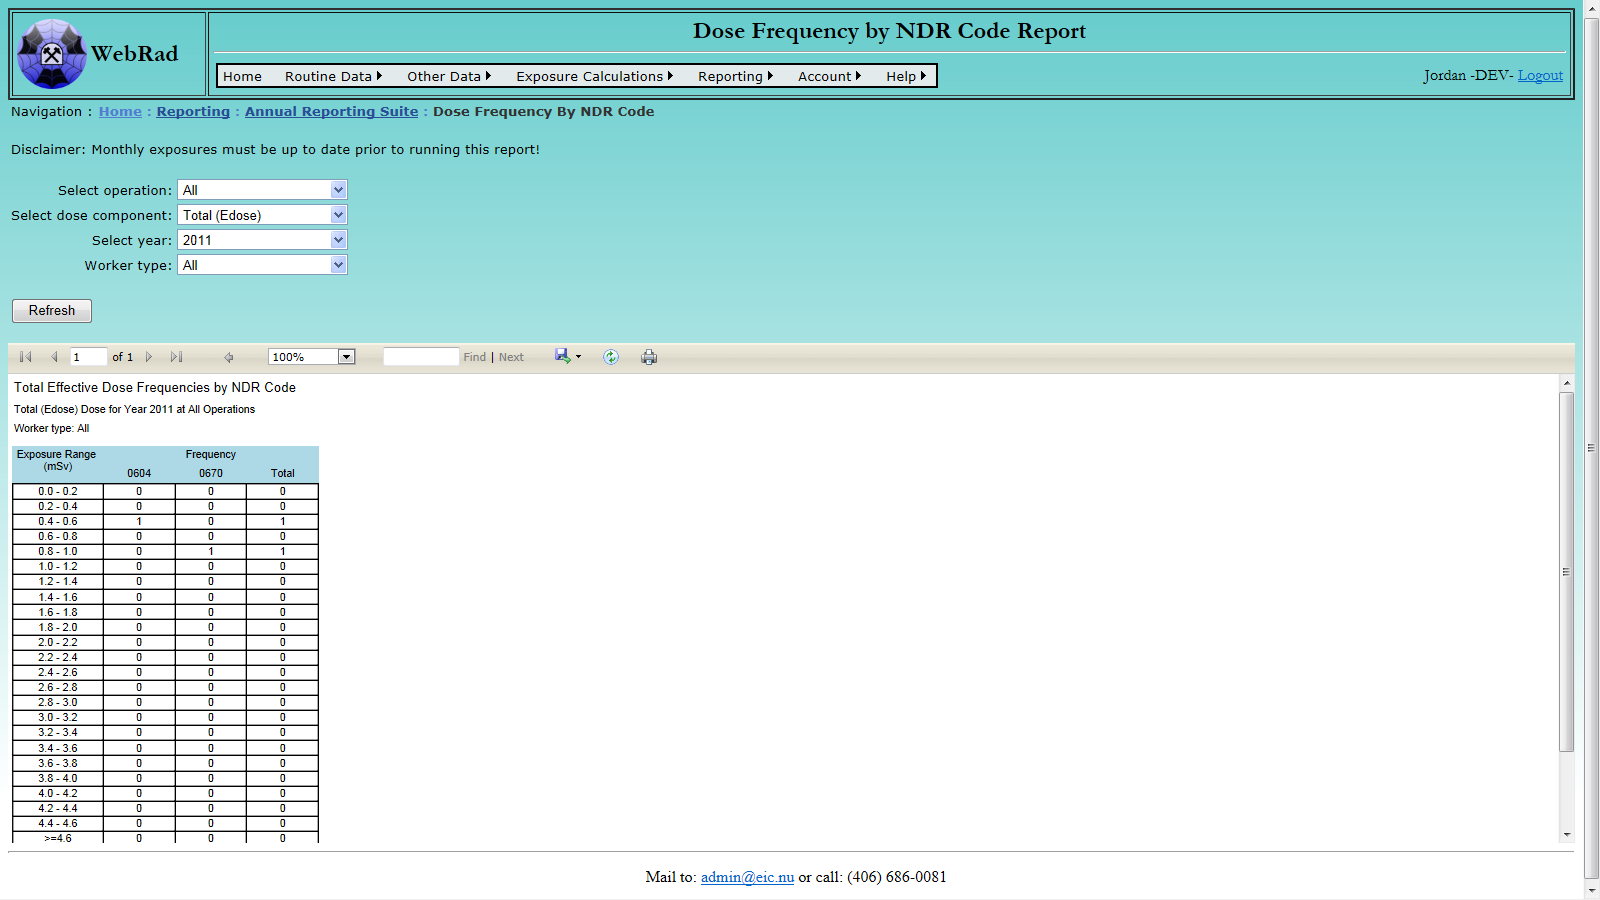
12.3.3 Dose Summary
To get to the report mouse over "Reports" on the menu bar, go down to "Annual Reporting Suite" then go over and click on the "Dose Summary" link. This report is an operation specific report used to generate aggregate statistics based on employee groups and months.
Select an Operation to run the report for. A filtered list of Employee Groups will then be generated to select from. Next, select the Dose Component type to calculate totals for. Note that the LLRD selection contains all three LLRD contaminants (Ore, Calcined Yellowcake, and Non-Calcined Yellowcake). Next, choose the Year for which the report is to be ran. Finally, select the Worker Type and click on the "Refresh" button.
Special Note: Employees are categorized as NEW's if they were set as a NEW at all in the given report year. The employee history used for each employee is selected by taking the history with the most recent 'Hire Date' that is less that the report end date. The collective dose per tonne of uranium column is used to enter the uranium mined in the given month after the report is generated for auditing purposes.
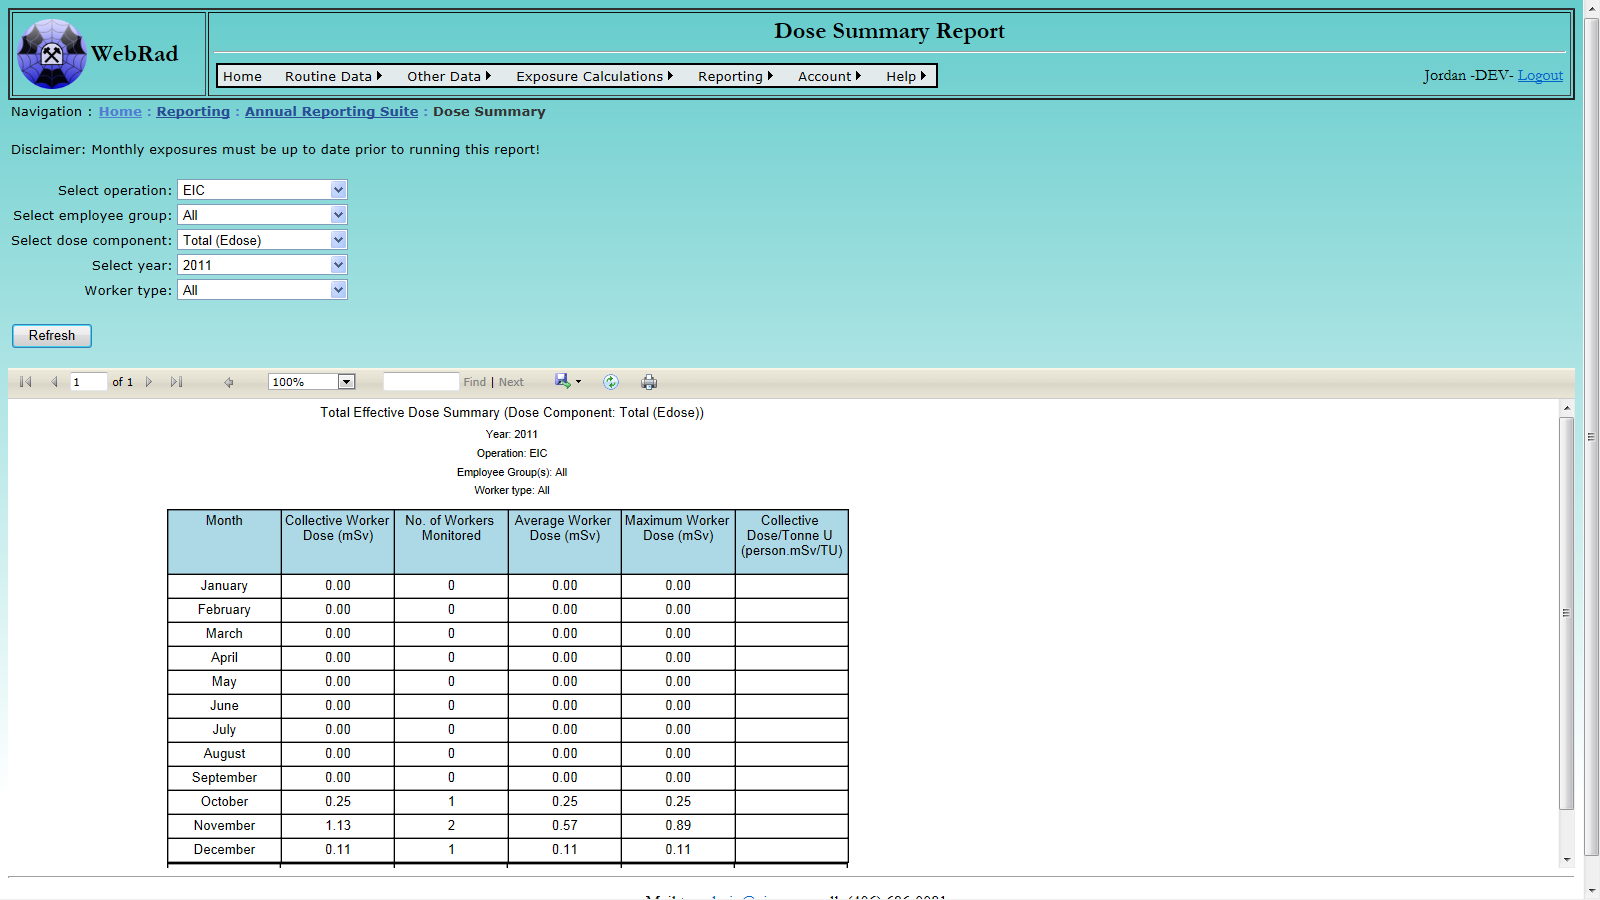
12.3.4 5 Year Dose by NDR Code
To get to the report mouse over "Reports" on the menu bar, go down to "Annual Reporting Suite" then go over and click on the "5 Year Dose by NDR Code" link. This report is an operation specific report that shows the frequency of employee total effective dose over the past five years.
Select an Operation to run the report for. Next, choose the Year and Month for which the report is to be ran until. Select the Worker Type and click on the "Refresh" button. The report will pull all data 60 months prior to the month selected.
Special Note: Employees are categorized as NEW's if they were set as a NEW at all in the 5 year span. The employee history used for each employee is selected by taking the history with the most recent 'Hire Date' that is less that the report end date.
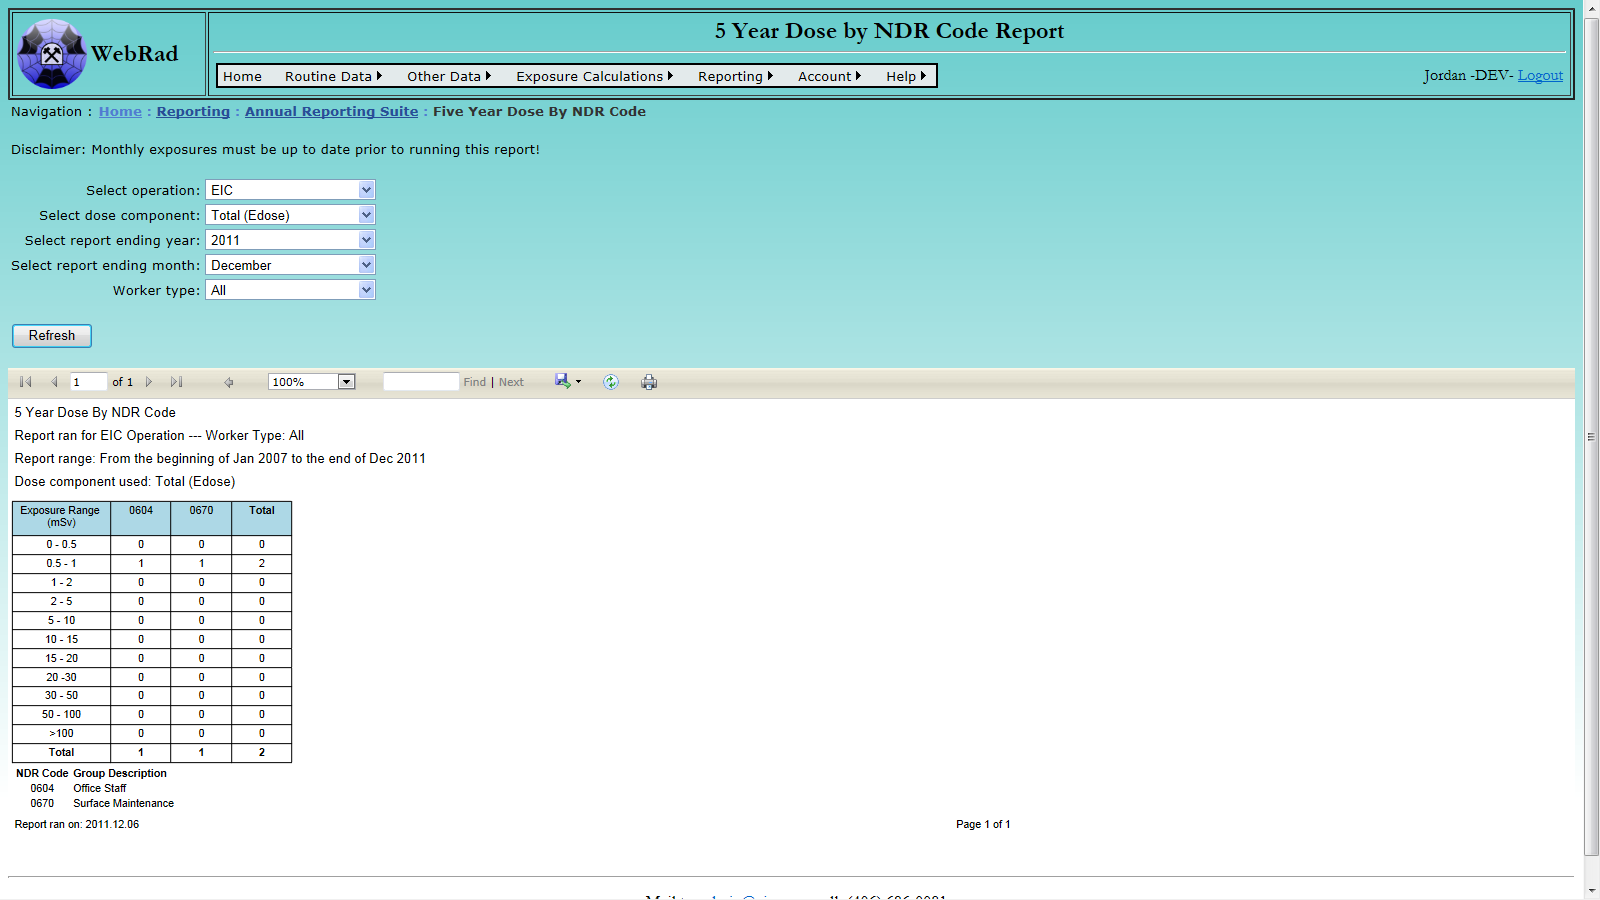
12.4 France Reporting (AREVA Specific reports)
The following are AREVA specific reports used to generate year end statistics for the France head office. Because the smallest division of time for these reports is a single month, they are based off of the monthly stored exposures table. This means that prior to running these reports, all monthly data must be up to date.
12.4.1 Sustainable Development Report
To get to the report mouse over "Reports" on the menu bar, go down to "France Reporting" then go over and click on the "Sustainable Development Report" link. This report is an operation specific report that shows a years worth of statistics on Internal and External exposures for Areva employees and non-Areva employees. Internal exposures includes inhaled contaminants such as LLRD and RnP while external exposure includes contaminants directly effecting the body such as Gamma exposure.
Select an Operation to run the report for. Next, choose whether to display the Areva employees or non-Areva employees. Select the report ending Year and Month. Finally, select the Worker Type to be used and then click on the "Refresh" button. The report will pull data for 12 consecutive months prior to the report run date (i.e. selecting the end date of Dec 2010 will run the report from the beginning of Jan 2010 to the end of Dec 2010).
Special Note: Employees are categorized as NEW's if they were set as a NEW at all in the span of the report. The employee history used for each employee is selected by taking the history with the most recent 'Hire Date' that is less that the report end date.
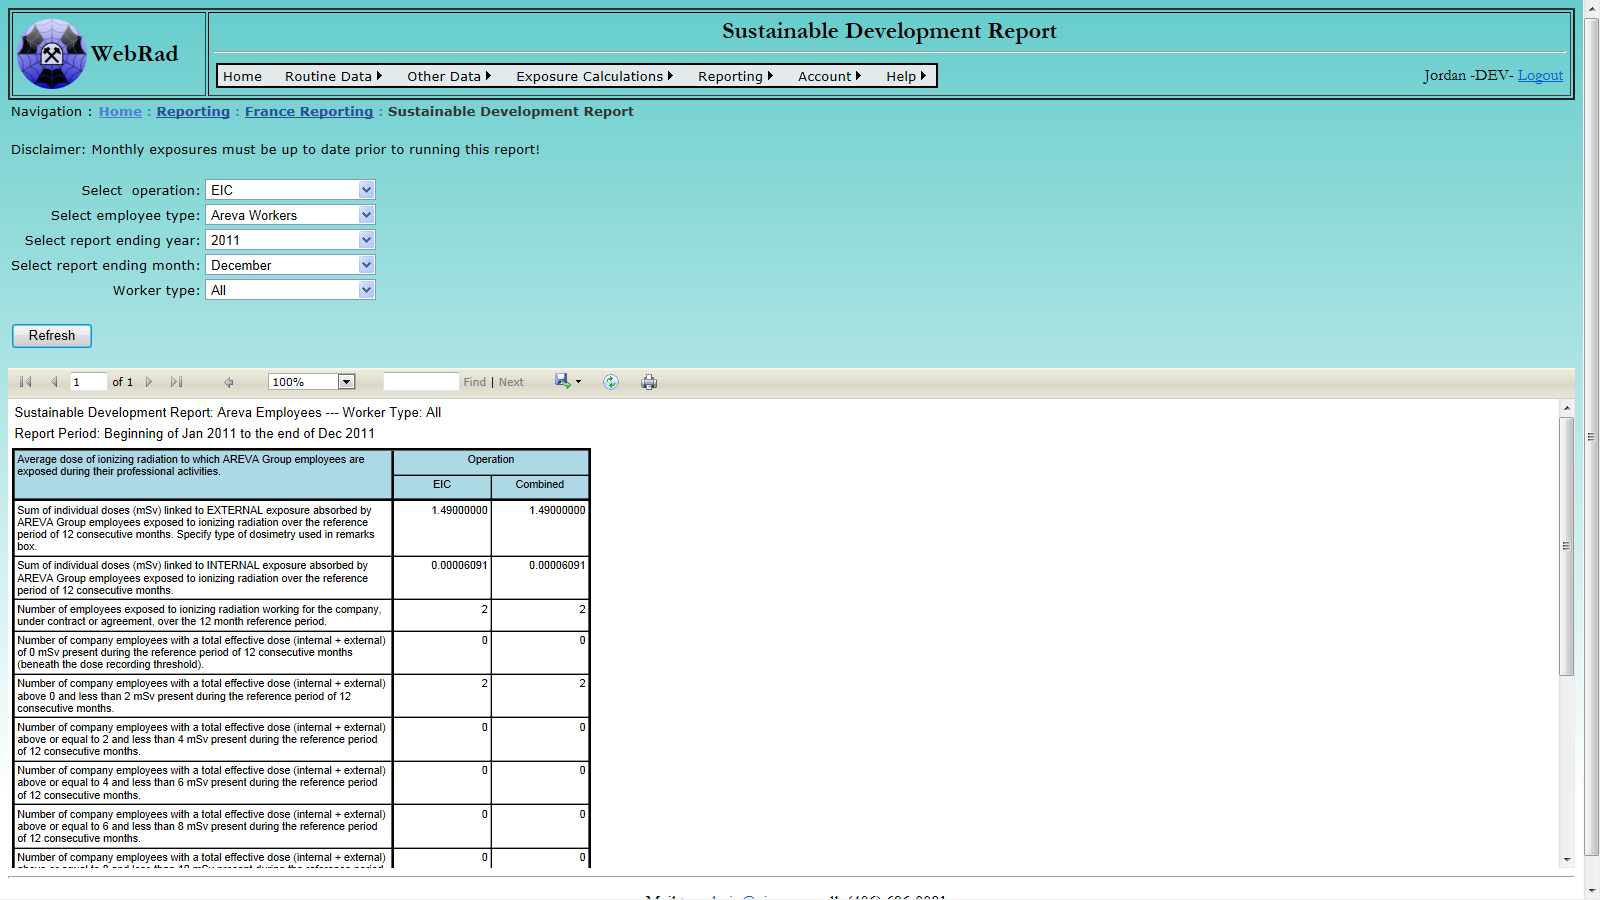
12.5 Contamination Control Reporting
This category of reports is used to display aggregated values of Contamination Control readings at various locations around the site.
12.5.1 Contamination Control Swipe Report
To get to the report mouse over "Reports" on the menu bar, go down to "Contamination Control Reporting" then go over and click on the "Contamination Control Swipe Report" link. This report is used to report specifically on the three readings from a Contamination Control Swipe; Alpha Reading, Beta-Gamma Reading, and Total Reading. If it seems that the sum of the Alpha and Beta-Gamma readings do not equal the total, then it is likely a swipe has been modified or partially deleted.
Select the Operation for which the report is to be ran. This will filter a list of Sites to choose from. After selecting a Site, all available areas under that Site will become available to choose from in the Area list box. Multiple Areas may be selected by holding down "Ctrl" on the keyboard and highlighting mutiple areas. Select the Aggregate function to be used on the individual readings. Finally, choose an appropriate date range and click on the "Refresh" button to display the report.
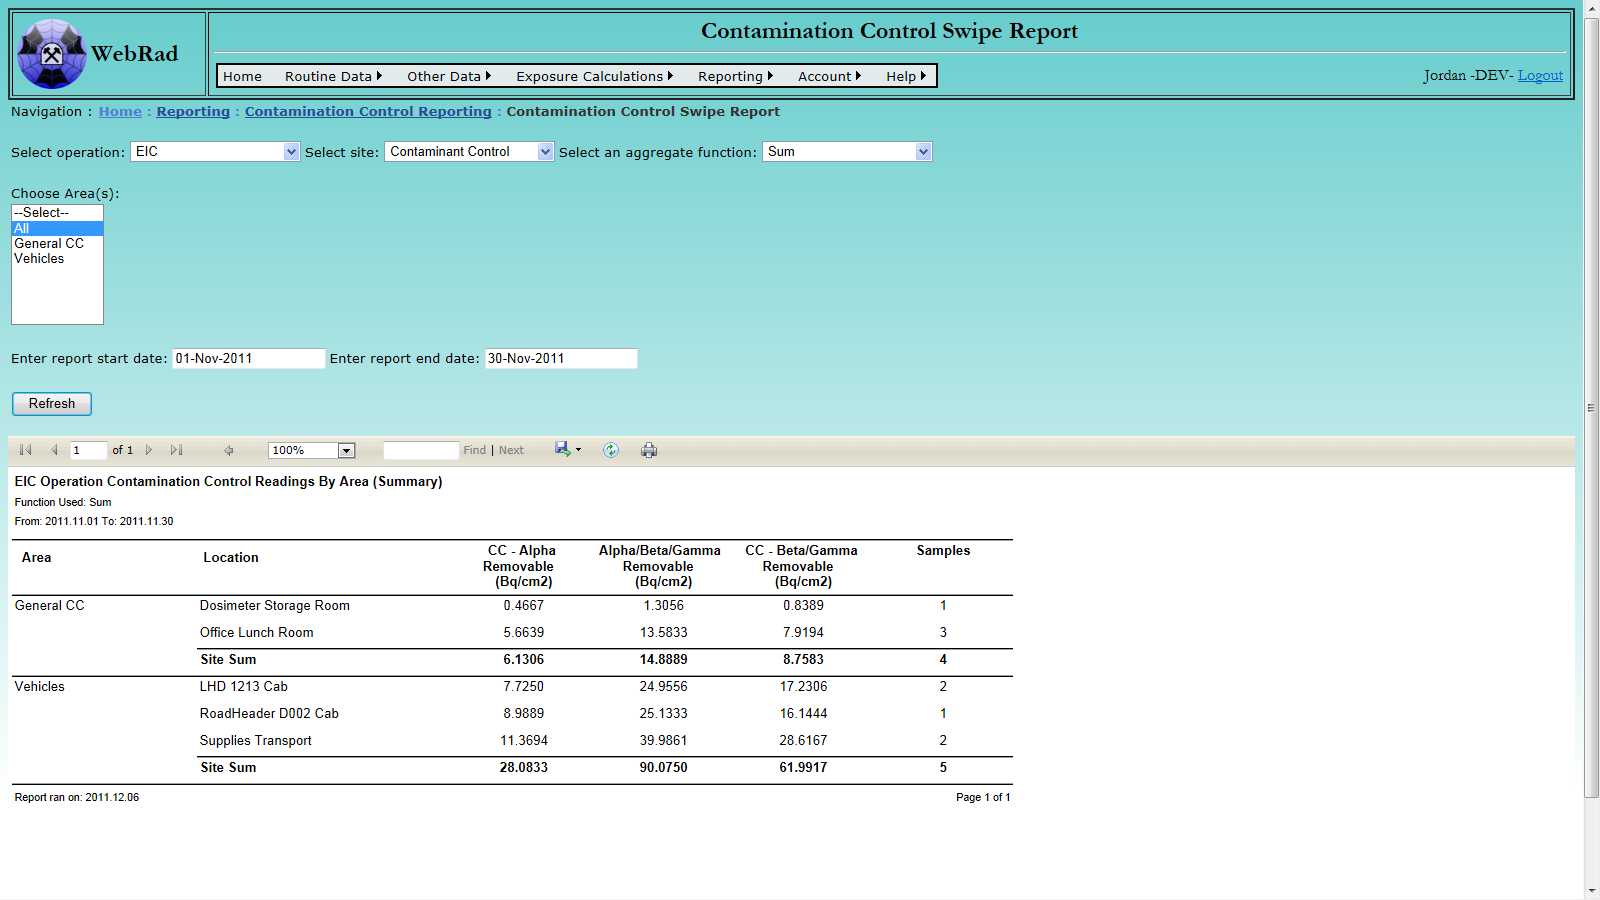
12.5.2 General Contamination Control Report
To get to the report mouse over "Reports" on the menu bar, go down to "Contamination Control Reporting" then go over and click on the "General Contamination Control Report" link. This report is used to report on any Contamination Control readings.
Select the Operation for which the report is to be ran. This will filter a list of Sites to choose from. After selecting a Site, all available areas under that Site will become available to choose from in the Area list box. Multiple Areas may be selected by holding down "Ctrl" on the keyboard and highlighting mutiple areas. Select the Aggregate function to be used on the individual readings. Next, choose the Contaminant to report on. This will filter the drop down for methods. Select the corresponding method, or select "All" methods. Finally, choose an appropriate date range and click on the "Refresh" button to display the report.
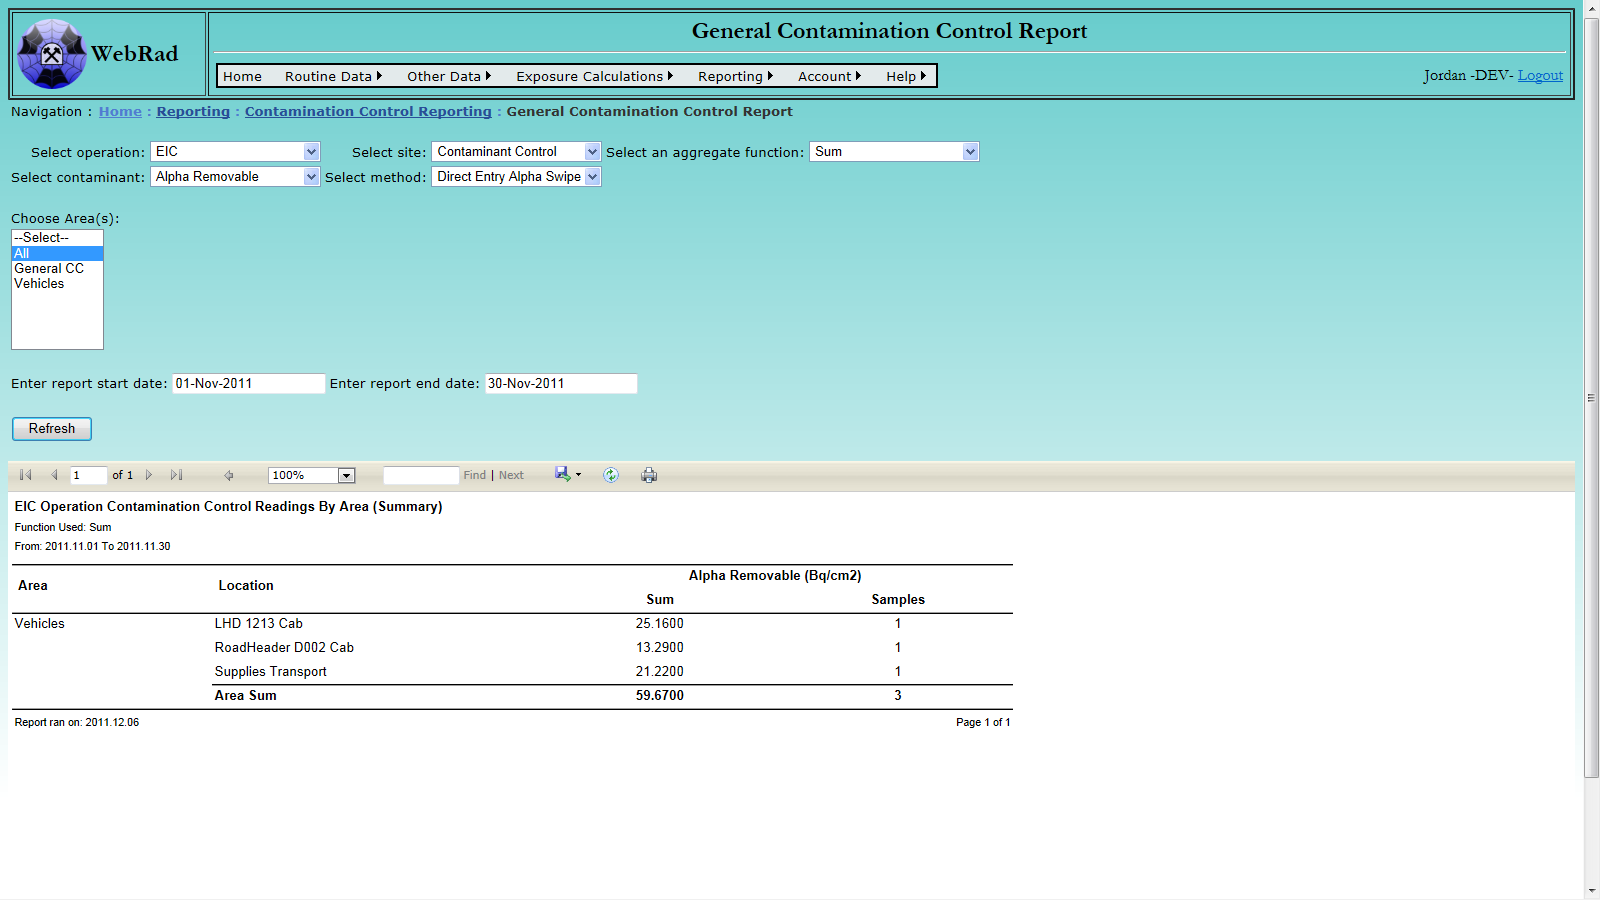
12.6 Ventilation Reporting
This category of reports is used to display Ventilation data for various areas of the mining operation.
12.6.1 Ventilation Report
To get to the report mouse over "Reports" on the menu bar, go down to "Ventilation Reporting" then go over and click on the "Ventilation Report" link. This report is used to display ventilation flow readings at various locations around the site. Readings are compared to their design specification and are bolded if they exceed the specification by +/- 15%. Locations that have no associated flow specification are bolded by default and have their percentage difference column populated with a "Missing Spec" note.
Begin by choosing an Operation. This will filter the Sites drop down box. Next choose one of the filtered Sites, which will in tern filter the Areas. Select a single area or "All" areas. Pick appropriate reporting "Start" and "End" dates. When choosing a date range, the start date time will be set to 00:00:00 and the end date time will be set to 23:59:59. Click on the "Refresh" button to display the report.
Note: In order to properly generate this report, a ventilation contaminant must be generated with a Contaminant Code of 'VENT'. At the moment, this contaminant must be created by EIC as contaminant codes can not be entered by the user from the front end.
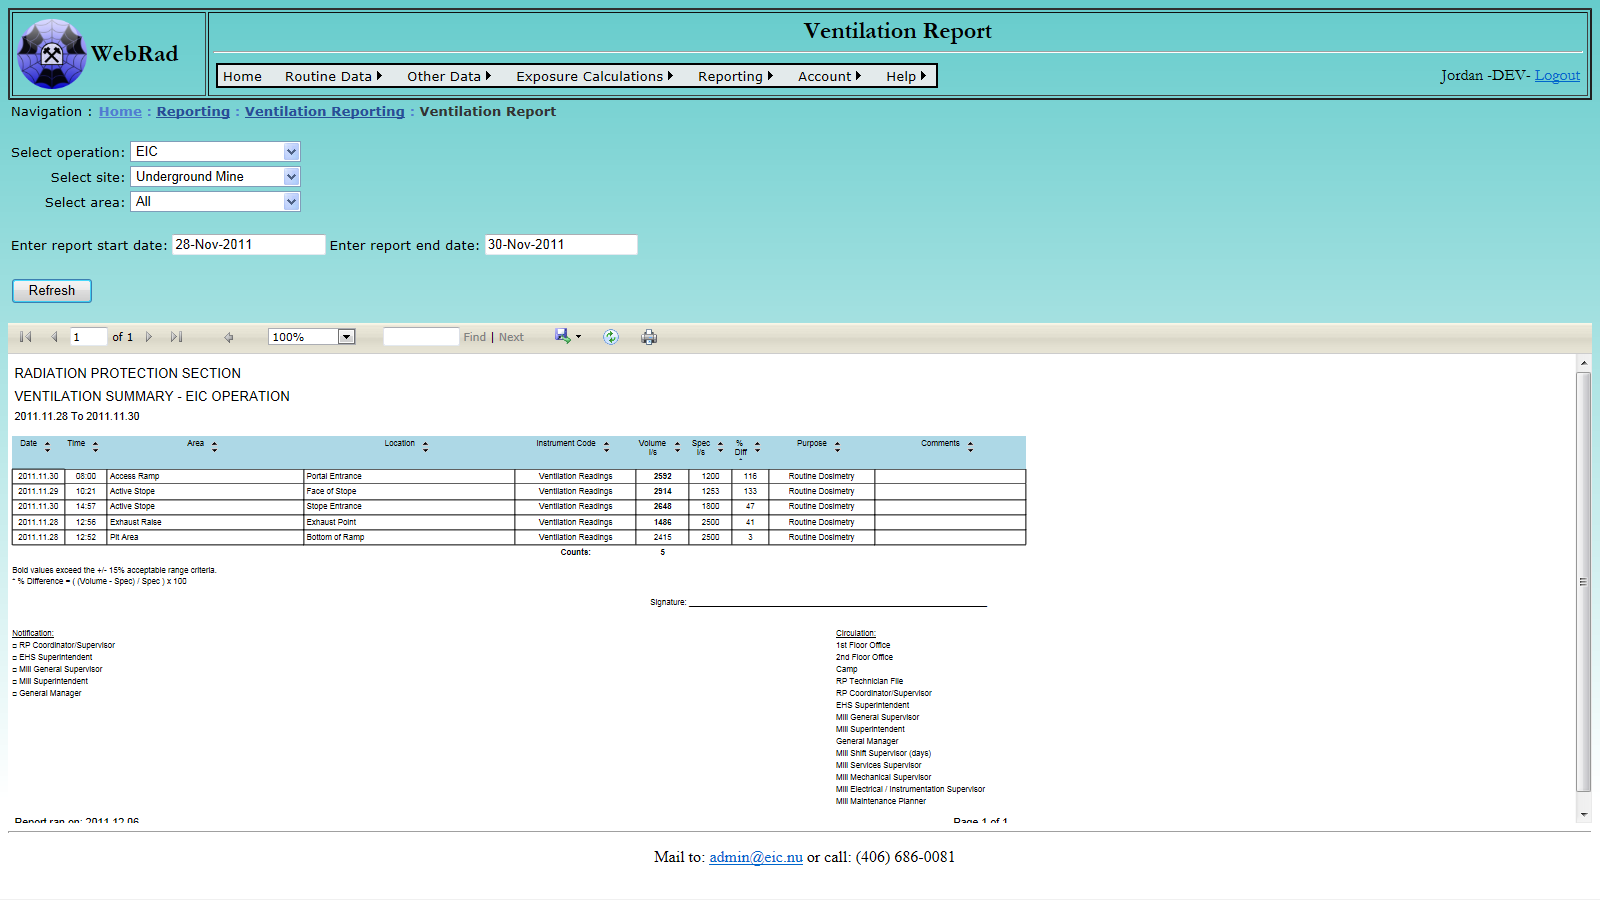
13. Account Management
13.1 Change Password
To change your password mouse over "Account" on the menu bar, go down and click on the "Change Your Password" link. Re-enter your old password and then choose a new one.
13.2 New User
To add a new user mouse over "Account" on the menu bar, go down and click on the "Create a New User" link. Enter all appropriate data and click "Create User". A warning will appear if any of the data needs to be changed.
The following are the roles for user accounts:
- Manager- Has full permissions and can add and manage new users. Typically there is only one manager per company, and managers cannot create new managers, but more can be created by request.
- Full Permission- Has all permissions except for adding and managing other users.
- Full Data Entry- Can enter any data and view reports, but cannot perform exposure calculations.
- Basic Data Entry- Can only enter routine data and view reports.
- View Only- Can only view reports.
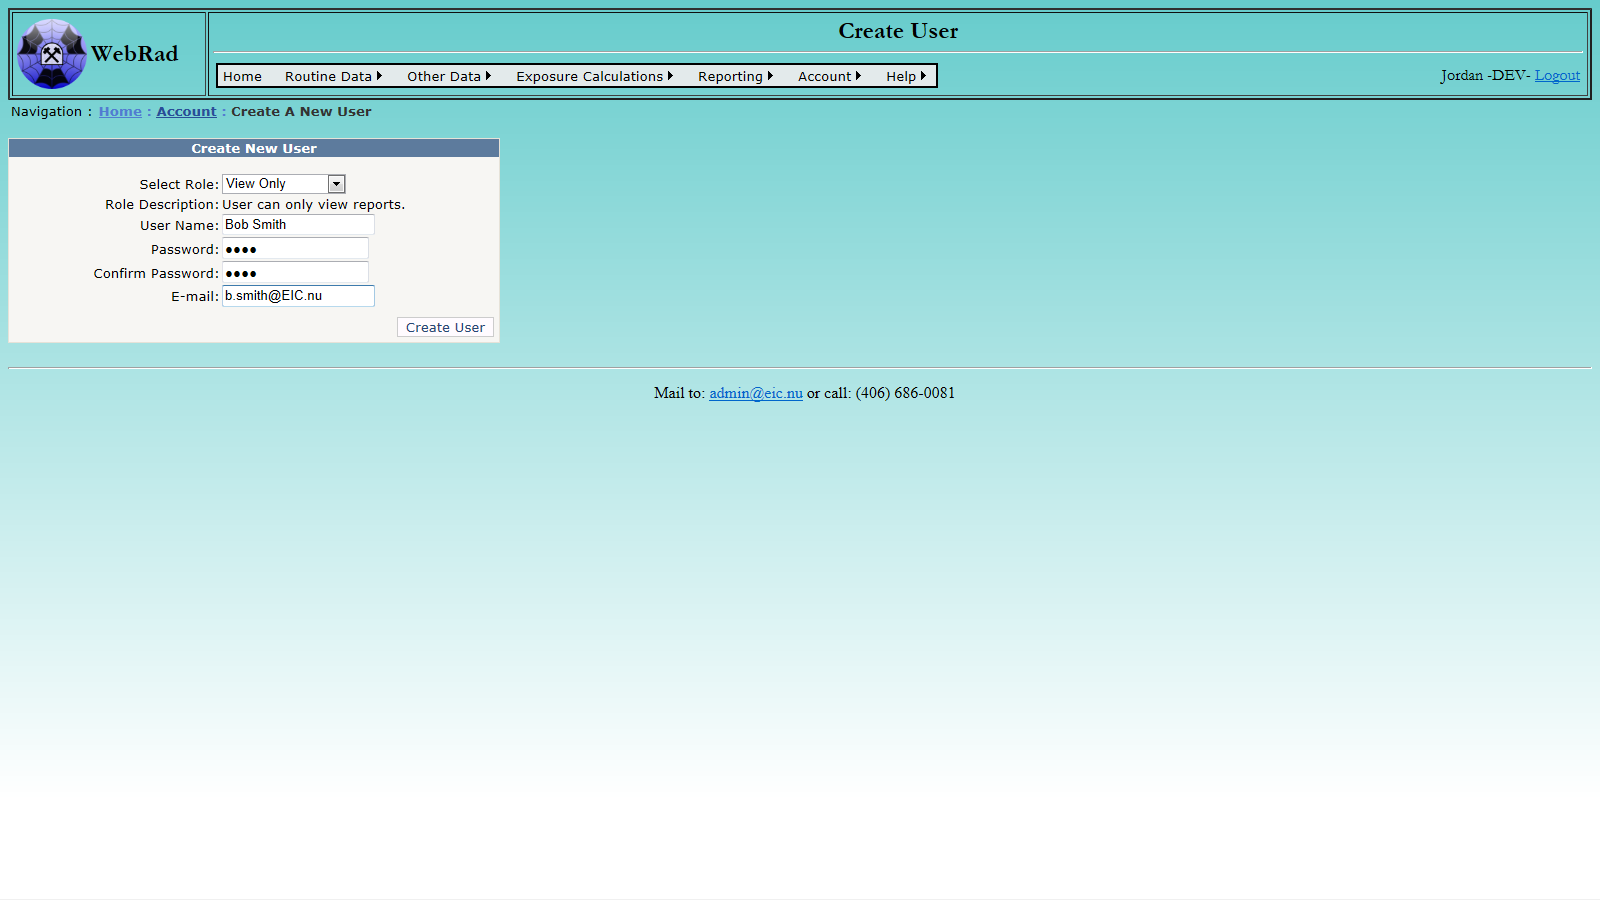
13.3 Manage Users
To manage your users mouse over "Account" on the menu bar, go down and click on the "Manage Users" link. From here you can change their role, change whether they are active or not (an inactive user is not deleted, but will not be able to log in), and delete users.